Last November, Google announced that the new Page Experience algorithm update would roll out in May 2021, raising a whole new set of expectations for site owners to meet.
However, it is now set to start rolling out in mid-June, giving us all more time to prepare.
A big part of the update is focused on three new metrics, called Core Web Vitals, which Google will use to determine whether or not your website provides a good user experience. In this article, we will delve into how to pass core web vitals.
What Are Core Web Vitals?
These metrics are:
- Cumulative Layout Shift (CLS)
- Largest Contentful Paint (LCP)
- First Input Delay (FID)
To help you pass the core web vitals test, we’re going to explore how to identify issues on your site and optimize your website’s performance in simple steps.
How to Pass Core Web Witals
Before you can start working on improving your core web vitals, you need to know where your website is falling behind. So, let’s walk through a simple checklist you can follow to find optimization opportunities:
- Check the Google core web vitals report
- Identify potential problems
- Dig deeper using PageSpeed Insights
- Use the core web vitals extension to check individual pages in real-time (optional)
1. Check your core web vitals report in Google Search Console
Google added a new set of reports on their search console. For this article, let’s focus on the Core Web Vitals report.
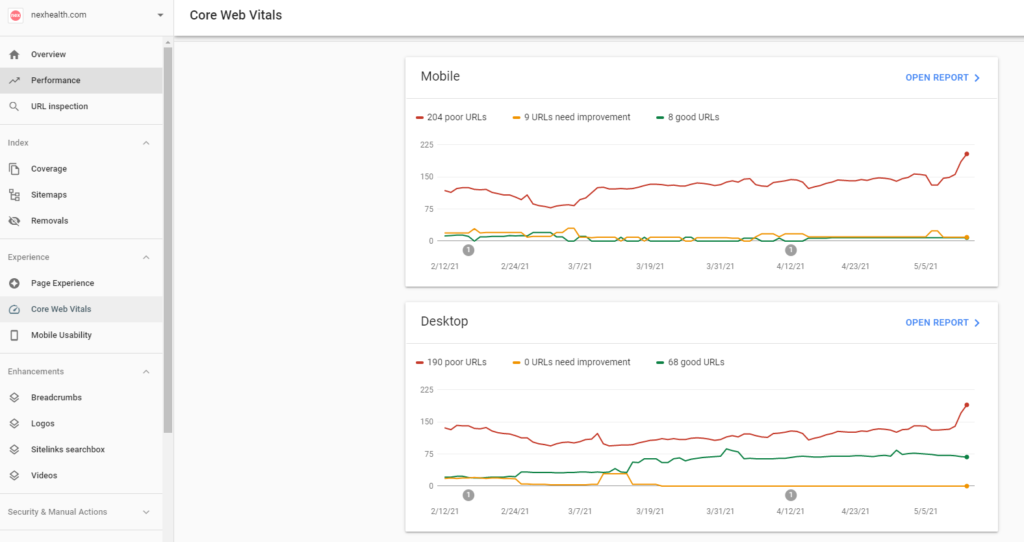
When you click on the tab, you’ll see two different graphics: one for your site’s mobile experience and another for your site’s desktop experience.
As you can see in the graphic above, NexHealth has 204 poor URLs on mobile and 190 on desktop.We recommend that you look at your mobile report first, as Google (predominantly) uses the mobile version of your website for indexation (here’s more information about mobile-first indexing from Google).
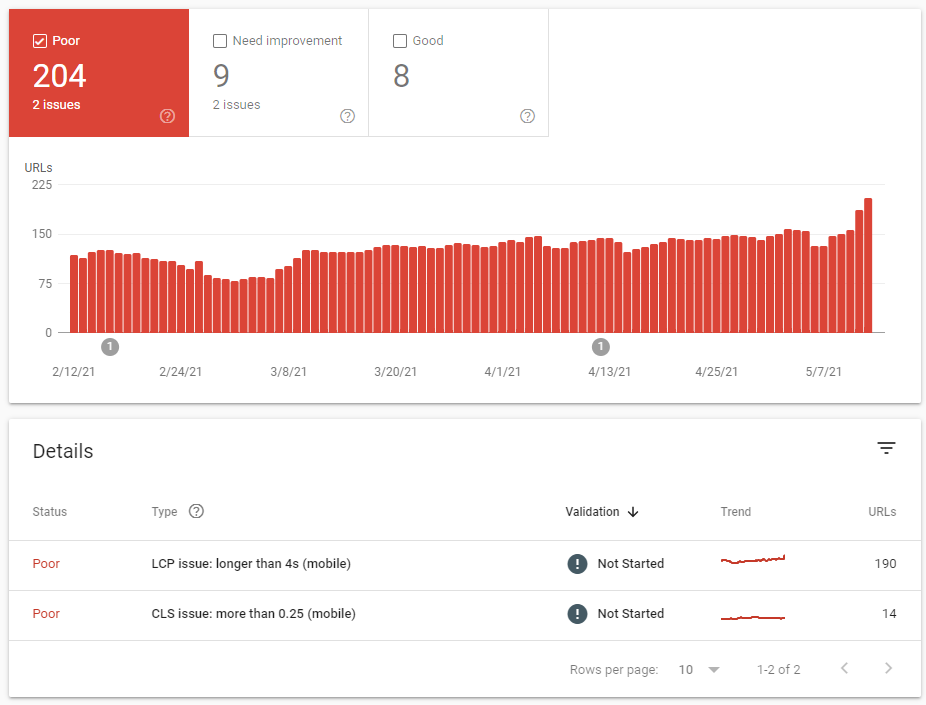
After clicking “Open report,” Google Search Console (GSC) will show where your pages are failing. In this case, it seems that the largest contentful paint (LCP) is longer than 4 seconds – way beyond the 2.5 seconds optimal speed.
Clicking on the issue will show you a list of URLs presenting the same problem.
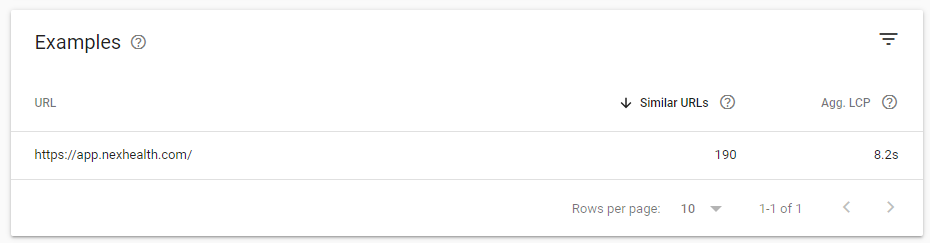
To look at the rest of the URLs, just click on the sample page, and you’ll be able to see the rest of the pages.
2. Identify potential problems
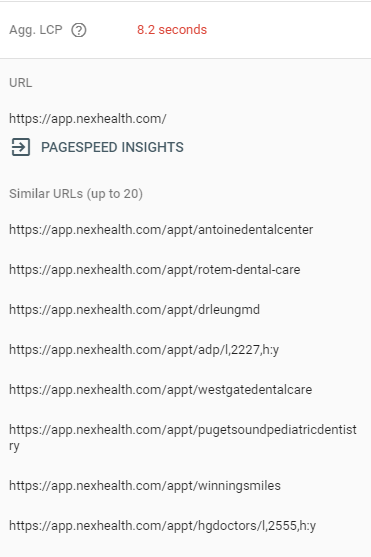
Here’s where it gets interesting. Search Console is showing us 190 URLs with LCP issues. However, most of these pages are actually app-related pages.
Of course, having a great user experience on your app is as important as on your website, but may not be as vital for SEO.
For example, it might be more critical for login pages to optimize their first input delay (FID) because what users care about is being able to add their credentials and log in to their accounts.
In that particular case, the time it takes to load a background image wouldn’t be such a big deal.
Note: John Muller confirms that relevance is still a critical ranking factor on Google’s SEO Office-Hours. So adjust your optimization strategy accordingly to your users’ intention.
3. Dig deeper into the problem using PageSpeed Insights
If you look at the cumulative layout shift (CLS) from Rooftop Designs, you can see that it is over 0.25 seconds; 0.1 seconds is the optimal CLS time to hit the “good” score.
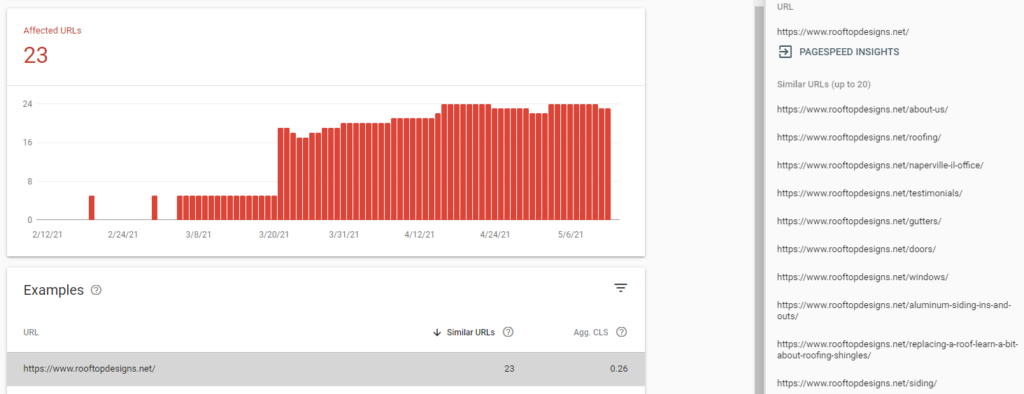
These are definitely pages that you want to rank on Google, so let’s take a look at your main pages within PageSpeed Insights by clicking on the shortcut on the right.

This is why it’s important to not just rely on one tool. You want to make sure you see the big picture.
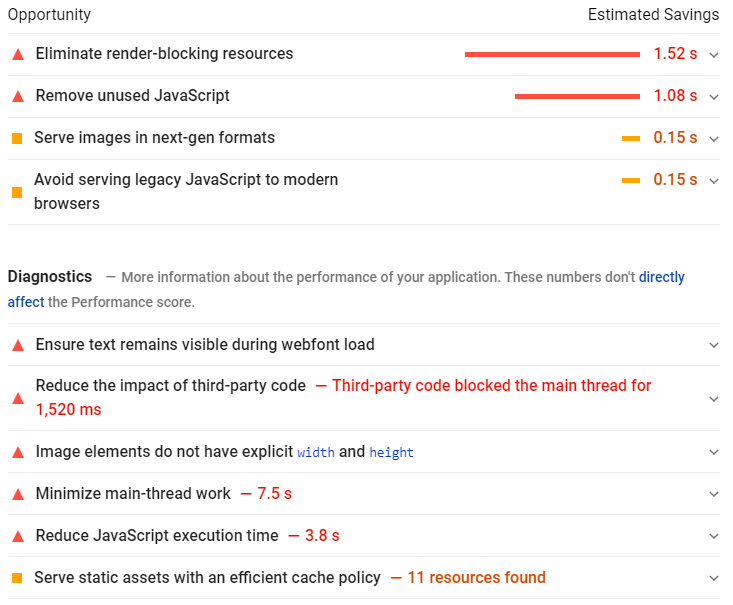
The page speed tool doesn’t register any CLS issue, but it does identify LCP problems on the “About Us” page.
This tool also provides a more detailed report on those issues and potential guidance for solving them.
Tip: You could also run a test with GTmetrix to collect more data to compare.
4. Check the main pages on your site with the core web vitals extension (Optional)
If you want to take it one step further, you can also check individual pages using the core web vitals extension to spot problems in real-time.
Once you install it on your browser, the extension will measure the three metrics as the page loads.
Tip: Use this time to look at your page’s overall performance. Click on different links, take a look at your images’ file size and format, navigate your site and write down any issue that comes up.
As you work through this checklist, take notes on a doc or a spreadsheet, and set goals accordingly.
Now that you have a list of URLs and issues to take care of, it’s time to move to the actual optimization.
How to Improve Your Core Web Vitals Score
Although we’ll be talking about each web vital individually, it’s essential to understand your website’s speed as the combination of different elements and interactions.
Things that can improve your CLS might also help you with your FID, and sometimes even “unrelated” optimizations could affect your core web vitals without it being your intention.
In the end, Google is pushing for a better user experience for the users, not just for you to hit specific numbers.
That said, let’s start by improving your cumulative layout shift.
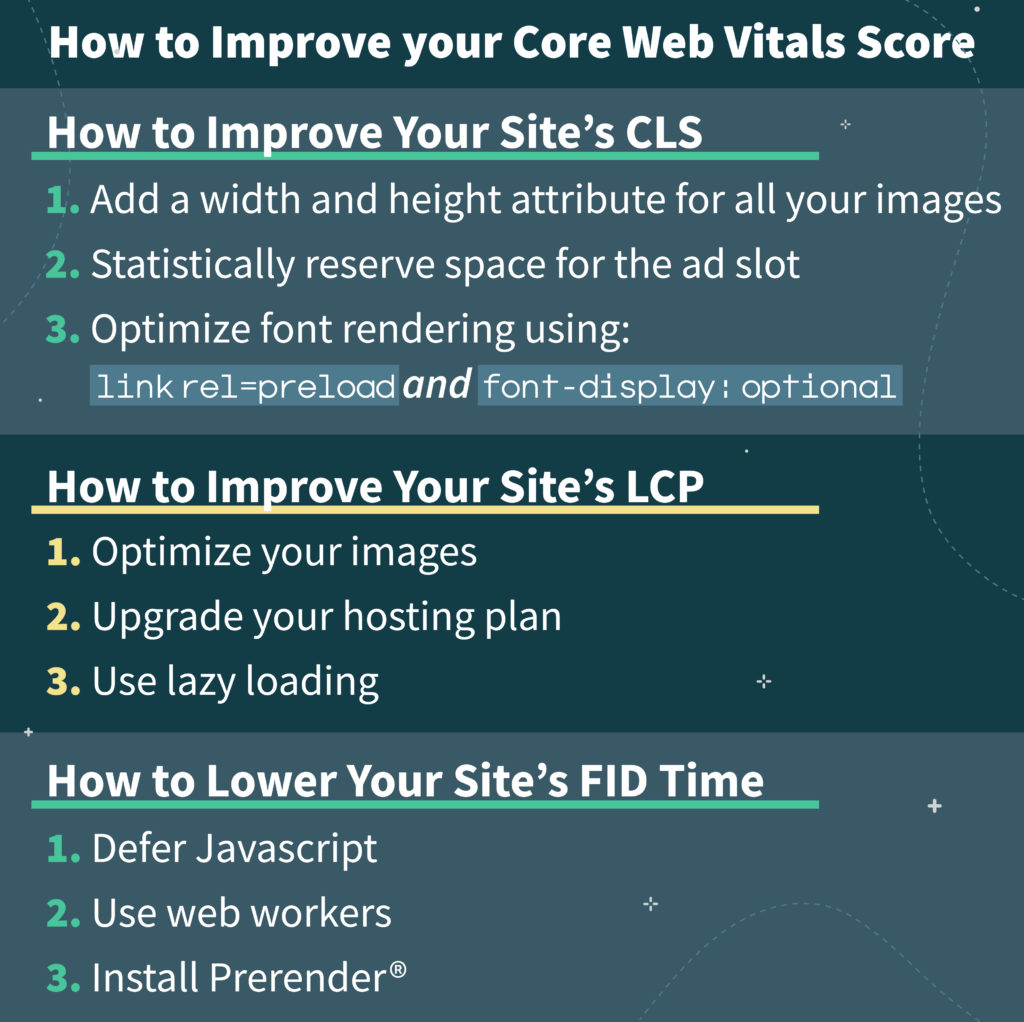
How to Improve Your Site’s CLS
Having a stable layout is important for users because when things start to move abruptly, it can cause very uncomfortable situations.
A simple example is misclicking:
- In some cases it could be annoying, like things moving while you are navigating a menu, making you click on a different page.
- In an eCommerce scenario, it could also become a source of stress and anxiety (e.g. wanting to cancel your order but clicking “Confirm” instead).
You want to keep it consistent for users so they can have the best interaction possible.
So how do you do that?
1. Add a width and height attribute for all your images
Doing this will basically tell the browser how much space within its layout needs to save for the image.
For example:
1 2 | <! — set a 640:360 i.e a 16:9 — aspect ratio →<img src=”laptop.jpg” width=”640" height=”360" alt=”Macbook Air M1 2021” /> |
If you slow down your browser and load your page after adding these attributes, you’ll notice that it now will keep the space on the article while the images load, preventing the layout from shifting.When optimizing responsive images, you could use srcset to tell the browser what images to choose from and the dimensions of them:
1 2 3 4 5 6 7 | <img width="1000" height="1000" src="puppy-1000.jpg" srcset="puppy-1000.jpg 1000w, puppy-2000.jpg 2000w, puppy-3000.jpg 3000w" alt="Puppy with balloons"/> |
Example from web.dev
2. Statically reserve space for the ad slot
By doing this, you are styling the element before the ad tag library loads.
Because ad networks serve different sizes of ads, you need to take a look at your pages on different occasions, from different browsers and – if possible – different accounts, to figure out the optimal dimension for the element.
Also, try to avoid adding your ads on the top of the page or hero section. It’s better for them to load in the content flow and, even better, off-screen.
3. Optimize font rendering using link rel=preload and font-display: optional
Using rel=preload will make the browser display a fallback font if your custom font does not load before 100ms, preventing a flash of invisible text.
On the other hand, if your custom font is downloaded before the 100ms period, the browser will display it without swapping fonts. This prevents the layout from shifting to accommodate the new font.
How to Improve Your Site’s LCP
Let’s say you click on a link, and on the target page you see a block of text and a lot of white in the background for about 3 seconds.
What’s your first thought? When it happened to us, the first thing that crossed our minds was “this page is broken”.
LCP is a signal for users that the website they arrived at is functional and has the content they are looking for.
You want your above-the-fold content to be visible as soon as possible, including any video or image you want to present to the user.
When optimizing your LCP, you want to focus on one word: speed!
1. Optimize your images
Your image file size is a significant contributor to LCP. Bigger file size = slower loading times.
To decrease their size, there are three things you can do:
- Set the right dimension: 4000 by 4000 images don’t make sense. Think of how you will be using your image and what the best dimensions are for it. In most cases, 1200 by 1200 is more than enough.
- Use JPGs instead of PNGs: Just by changing the format, you can drastically reduce your image file size.
- Compress your images using TinyJPG.
2. Upgrade your hosting plan.
A faster server response will improve your page’s loading speed.
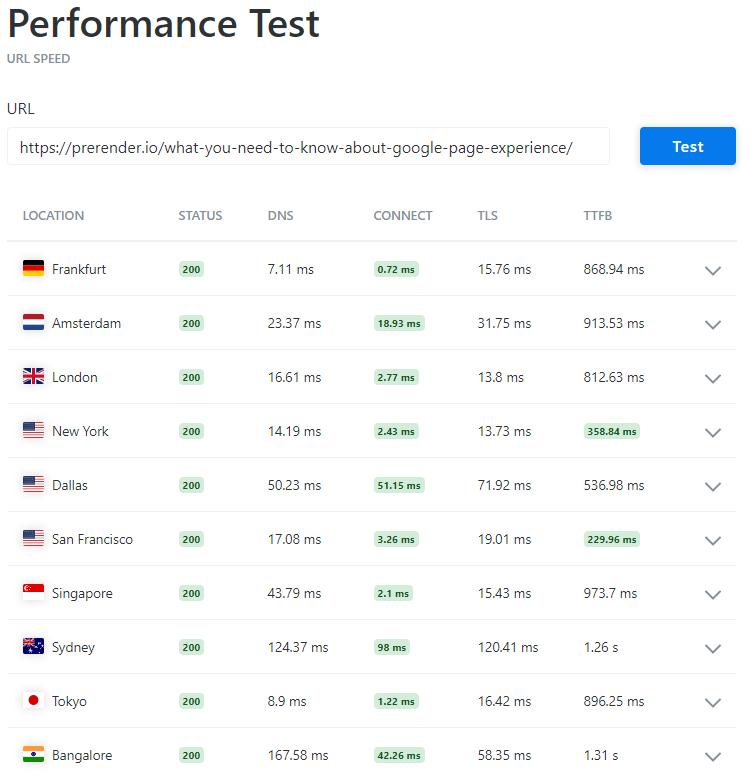
A simple way to see your server’s performance is by measuring your page Time to First Byte (TTFB) using a tool like KeyCDN.
All you need to do is type the page in the bar and run the analysis:
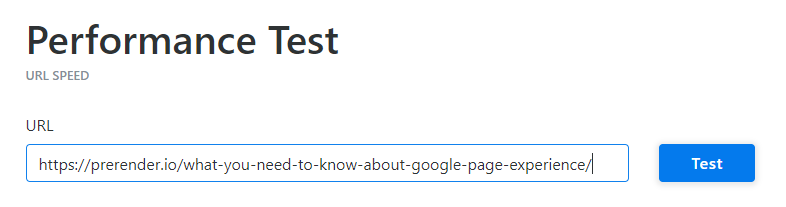
After the analysis is done, the tool will provide you with the times depending on the location of the request.
Another way to improve your TTFB is by using a content delivery network (CDN), like Cloudflare, to host and distribute your page’s assets from the nearest server to your user.
Tip: Use link rel=”preload” to make the browser prioritize essential assets and load those first. Here’s a quick example of how to use link re=”preload”.
3. Use lazy loading
LCP is all about how long it takes for the browser to load what the user can see on their screen. That means that everything under-the-fold can wait.
By enabling lazy loading, you let the browser take care of the elements visible in the viewport, speeding up the LCP time of your page.
Although you can do this using JavaScript, it would also make the browser waste time parsing the script. Instead, use the native lazy attribute within the image tag like this:
1 | <img src=”happy-cat.jpg” loading=”lazy” alt=”kitty playing with balloons” /> |
Note: Here’s an article from our CTO, Zoltan Bettenbuk, on how to improve a website’s loading speed. You’ll find some sample code you’ll be able to implement right away.
How to Lower Your Site’s FID Time
With regard to First Input Delay (FID), you need to put yourselves in the shoes of your users. When your page loads, what do they want to do?If you go to our home page, you’ll see that we have a form right in the hero section and two buttons on the right corner.
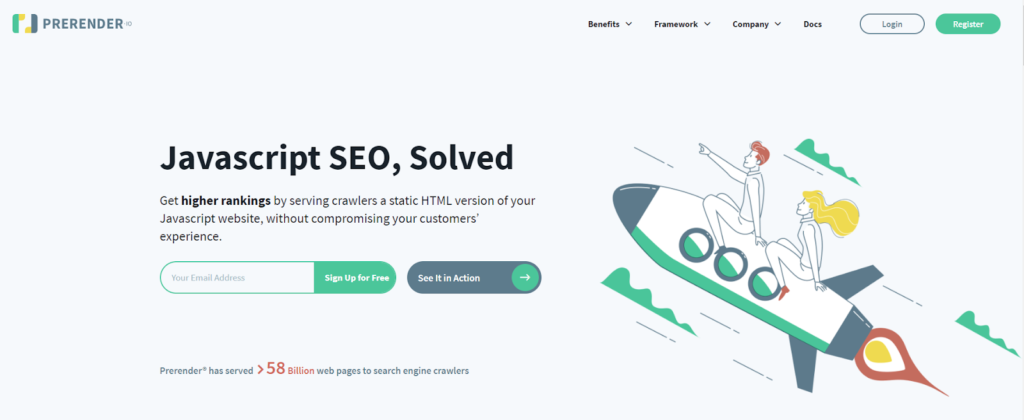
Our FID is the time it takes for the user to be able to interact with our form or login button.
As you can imagine, optimizations that work for LCP will also help your interactive elements load faster. However, there are a few other things you can do to decrease the FID time:
1. Defer Javascript
When you defer your JavaScript, you’re telling the browser to load your JS file after other elements are loaded (e.g. HTML and CSS), making your pages’ main content load faster.
Here’s an in-depth guide on using the defer attribute efficiently.
2. Use web workers
A web worker separates non-UI operations to a separate worker thread, making it possible to run JS on a background thread. This helps the website achieve FID faster.
Here are the recommended libraries by web.dev:
3. Install Prerender®
As stated above, hundreds of different elements contribute to your overall page speed and experience, making it more challenging – especially if your site is JavaScript-heavy – to find a nice balance between functionality and speed.
That’s precisely where Prerender® comes in. Our solution renders your pages on a fast server (under 500ms response times) in advance and optimizes them for the user agent.
If the user agent is a crawler like Google, Prerender® will provide it with a static HTML version to crawl and index.
On the contrary, if the middleware identifies the user agent as a human, Prerender® will redirect them through your normal server routes.
Wrapping Up
Providing the best user experience to your audience is crucial for long-term success. We have provided you with information on how to pass core web vitals.
Besides ranking, pages with excellent user experience have better conversion rates and higher returning users and are more likely to get shared. The latter can mean more organic links, which can boost your rankings even further.
Any doubts about how to improve your page speed? Let us know on Twitter, and we’ll make sure to help your site render faster.