Search is changing, and our dashboard is too: introducing the new Prerender.io dashboard.
This revamped dashboard enables you to analyze data at a glance and gain a deeper understanding of how crawlers interact with your site. Here’s an overview of what to expect when you log in.
What’s New
Seamless Domain Selection
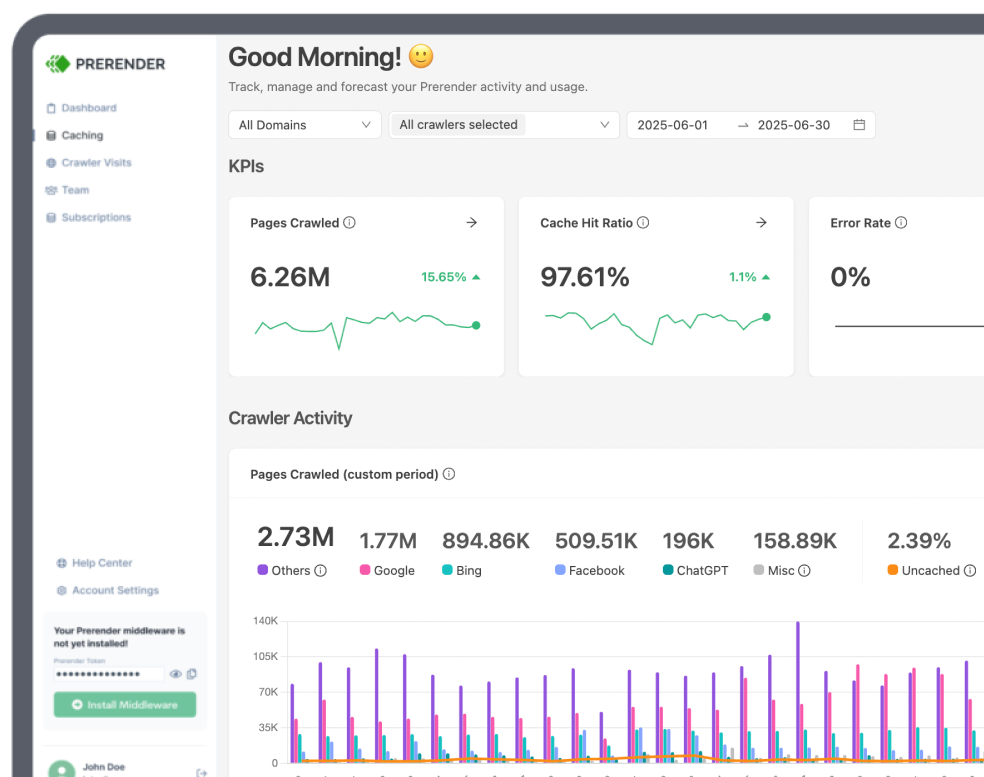
Starting from the top of the page, you can easily switch between viewing data for all domains in your account or solely focusing on a specific website. Ideal for agencies, this allows you to get a holistic view of your entire client portfolio or drill down into individual site performance.
Improved Data Analysis
We’ve significantly improved your ability to analyze data over a set time period. Now, you can select from preset options like “Today,” “This Week,” or “Last 30 Days,” or create custom date ranges to match your unique reporting needs and offer more insights. This will apply across both your Dashboard and CDN Analytics menu, helping you toggle between menus without resetting your filters. Note: you can view historical data going as far back as September 1, 2023.
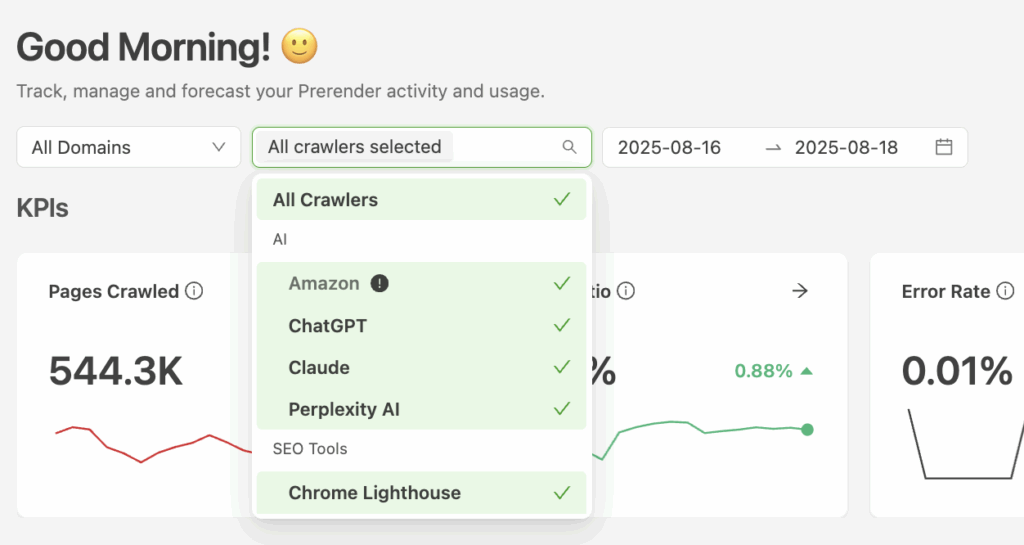
Crawler Type Filtering, Including AI Crawlers
One of the best new features is the ability to filter by crawlers, organized by categories like search, social, AI, or SEO tools. This gives you a deep dive into how crawlers interact with your pages, understand which crawlers to optimize for, and streamline your search strategy.
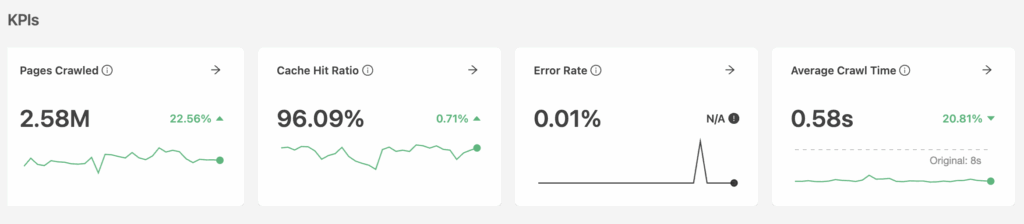
Customizable KPIs
Below your data filter settings, this new dashboard also features customizable KPI cards so you can quickly filter by metrics that matter most.
- Pages Crawled
- Track how many pages search engines are visiting, with percentage changes compared to previous periods and trend lines showing patterns over time.
- Cache Hit Ratio
- See how efficiently your pages are being served from cache instead of requiring fresh rendering. Higher percentages mean better performance and reduced server load.
- See how efficiently your pages are being served from cache instead of requiring fresh rendering. Higher percentages mean better performance and reduced server load.
- Error Rate
- Monitor the percentage of requests resulting in errors, helping you quickly identify and address potential issues before they impact your SEO. Anything over 1% may need your attention.
- Monitor the percentage of requests resulting in errors, helping you quickly identify and address potential issues before they impact your SEO. Anything over 1% may need your attention.
- Average Crawl Time
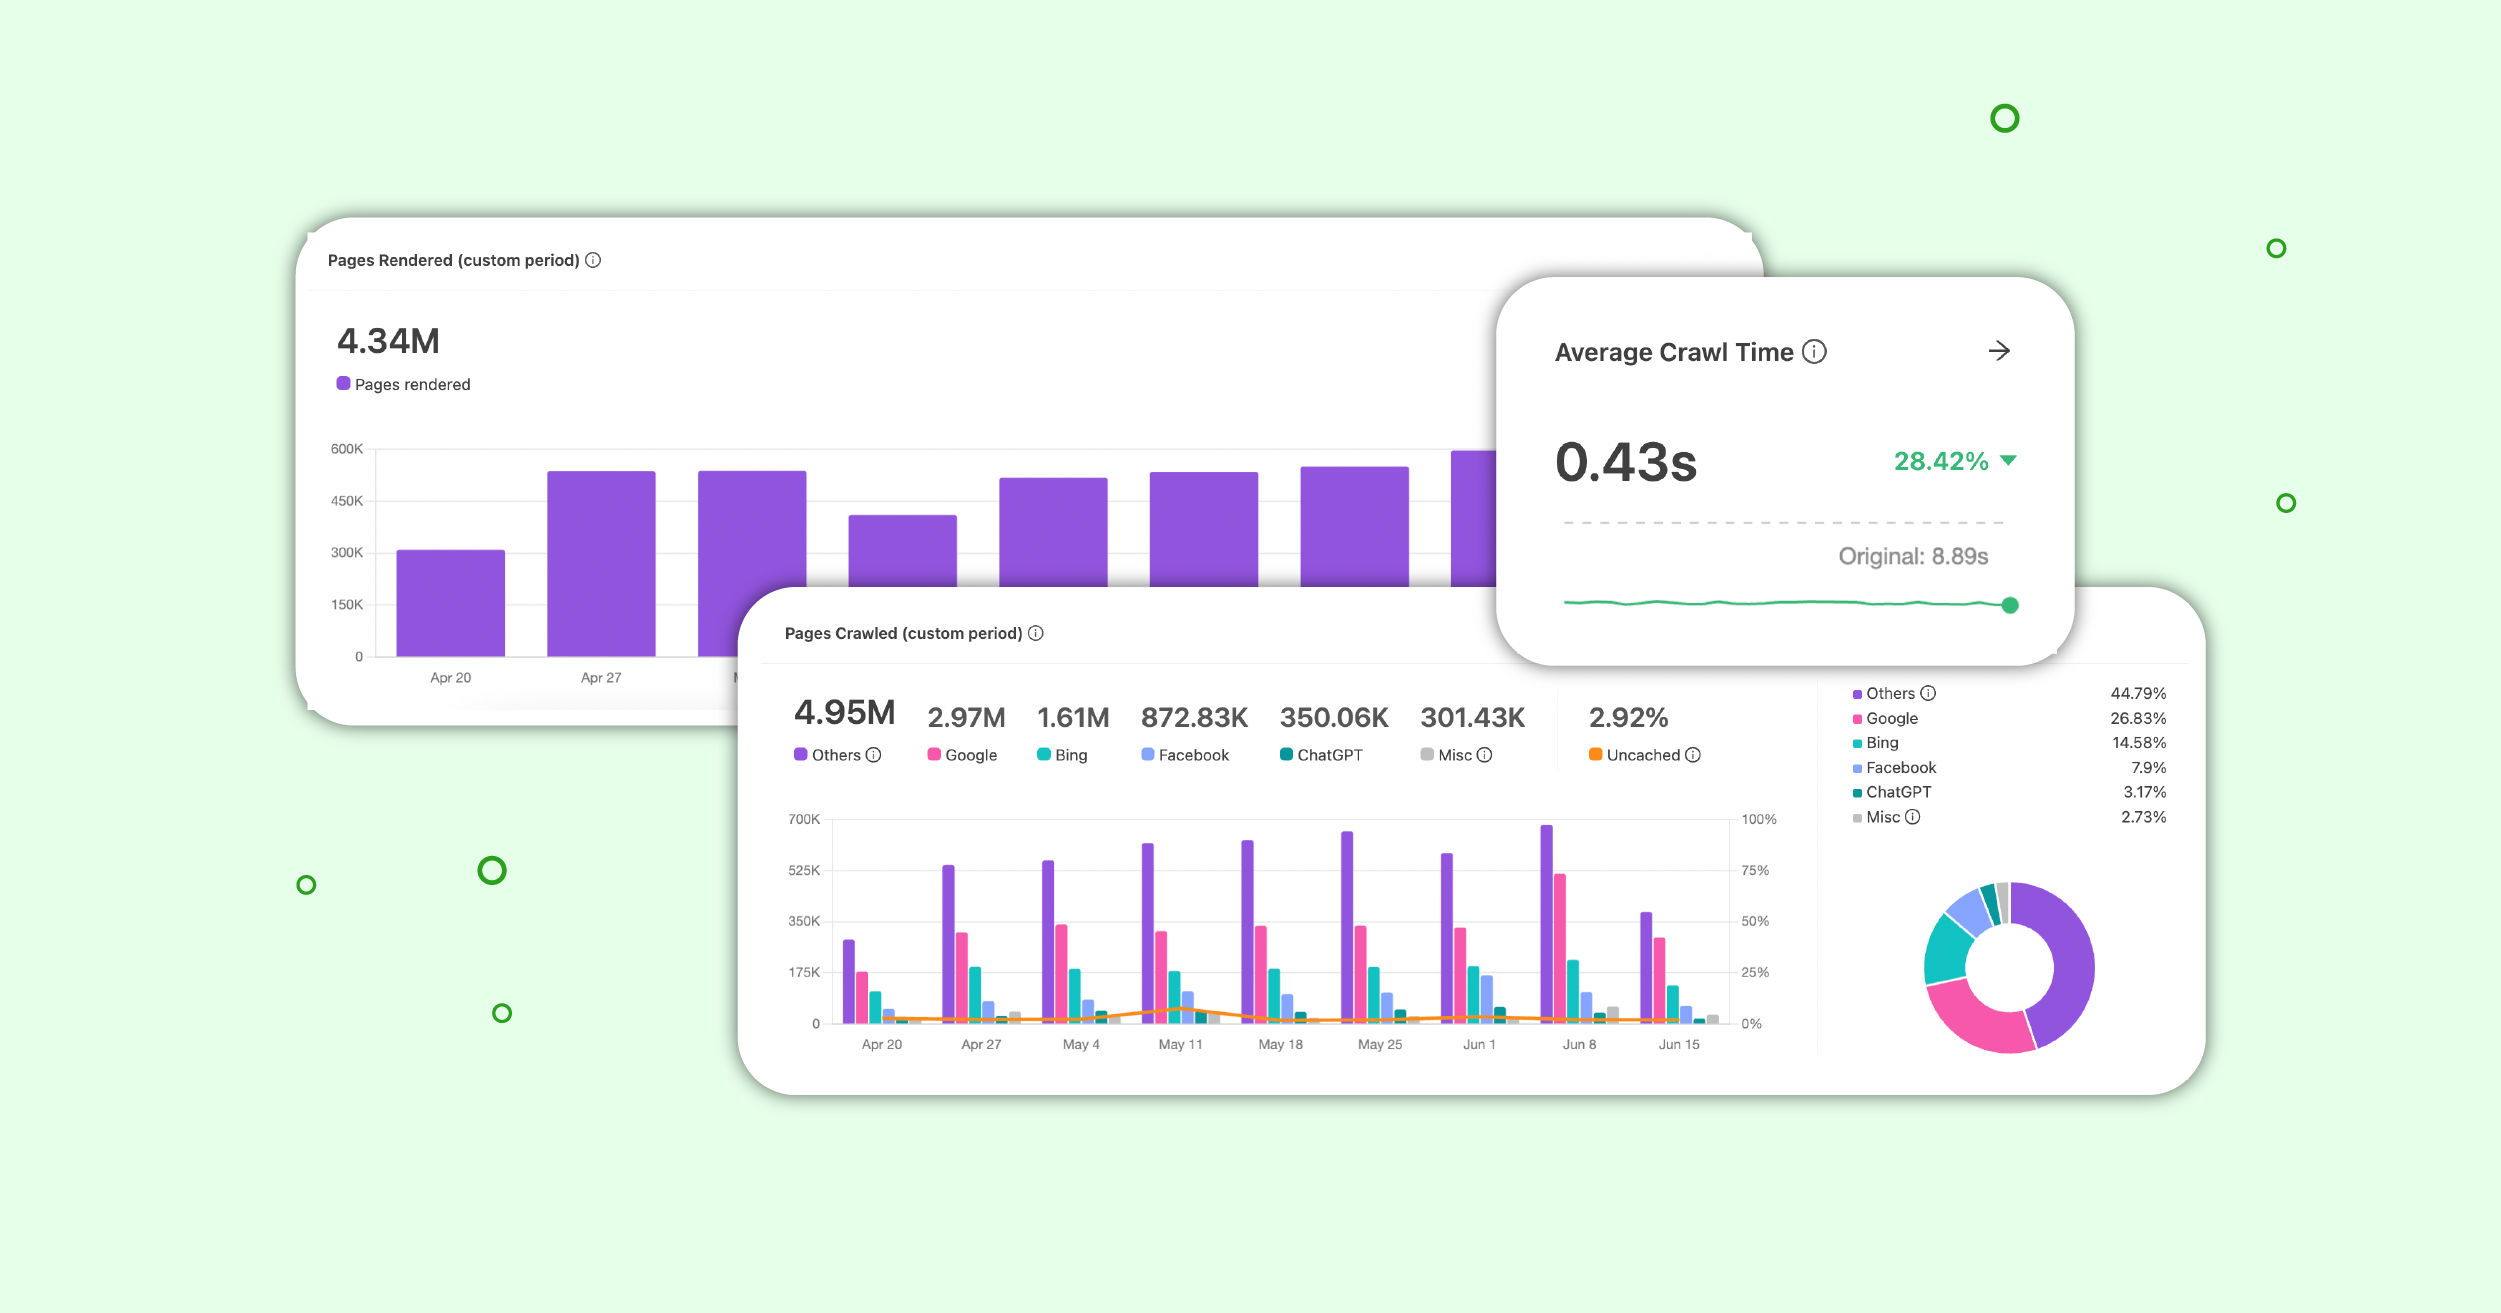
- Compare how quickly pages are delivered with Prerender.io versus without, demonstrating the tangible performance benefits of our service.
Visual Charts
Scrolling down, you’ll see a few main visual charts.
- Pages Crawled
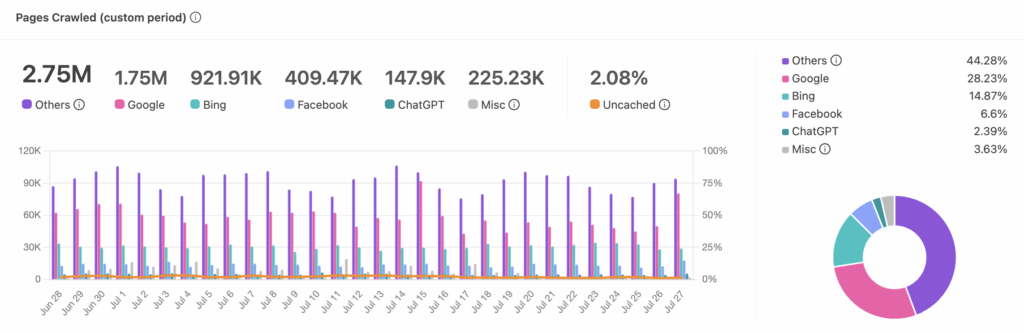
- Understand which crawlers (Google, Bing, ChatGPT, etc.) are most active on your site, with the top five categories displayed individually and smaller ones grouped for clarity.
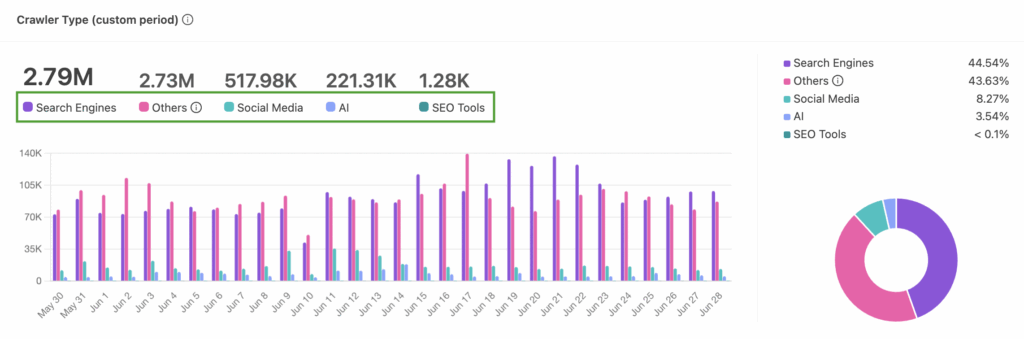
- Crawler Type
- View activity grouped by crawler categories (Search Engines, AI, Social Media, SEO Tools), making it easier to understand your traffic sources and optimize accordingly.

- View activity grouped by crawler categories (Search Engines, AI, Social Media, SEO Tools), making it easier to understand your traffic sources and optimize accordingly.
- Average Crawl Time Comparison
- See the direct performance time improvements with Prerender.io by comparing crawl times with and without our service.
- See the direct performance time improvements with Prerender.io by comparing crawl times with and without our service.
- Status Code Distribution
- Quickly identify any spikes in errors or redirects that could be impacting your site’s indexability. A new design allows you to view this at a glance, without the need for deeper analysis.
- Quickly identify any spikes in errors or redirects that could be impacting your site’s indexability. A new design allows you to view this at a glance, without the need for deeper analysis.
- Pages Rendered
- Track rendering volume trends to ensure comprehensive coverage of your site.
AI Crawler Activity
One of the most valuable additions is that you can now clearly monitor AI crawler activity.
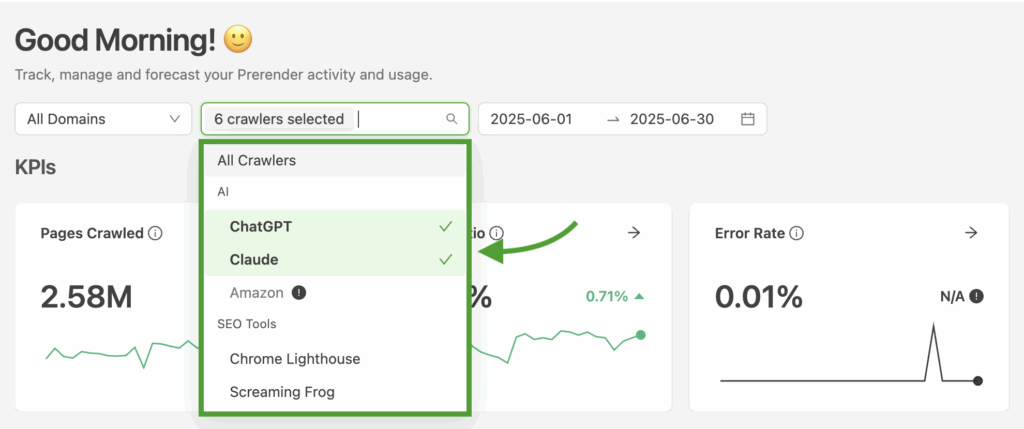
As AI search continues to grow, it’s crucial to understand how these crawlers interact with your pages. The new dashboard allows you to exclusively filter and view AI crawler activity at a glance, covering platforms like ChatGPT, Claude, Perplexity, and other emerging AI search tools. From there, you can optimize and adjust your SEO strategy accordingly.
Don’t see AI crawlers on your current dashboard? Remember to update your settings and allow key AI user agents.
How Does This Compare To The Old Dashboard?
Along with the improvements above, we’ve made several changes that may impact the platform’s usability and what you’re used to.
Relocated Date Picker
The date picker has moved to the left side of the dashboard. It now offers substantially more flexibility with additional preset options and custom date ranges.
Terminology Clarification
“Crawl Time” in the new dashboard is the same metric as “Delivery Time” in the old dashboard, measuring how long it takes search engines to load your pages.
Redesigned Crawl Budget Visualization
Crawl budget information is now presented more clearly in the Average Crawl Time chart, showing both the optimized time with Prerender and the original time without it in a side-by-side comparison.
Crawler Categorization
As mentioned, we’ve introduced more intuitive grouping of crawlers by both type (Google, Bing, etc.) and category (search engines, AI, social media, and SEO tools). This makes it easier to understand and analyze bot activity.
Curious to see the dashboard? Here’s a short video walking you through it.
Have Feedback? We’d Love To Hear
Remember: this is not a one-and-done upgrade. Your input is key as we continue to optimize. As you explore our redesigned dashboard and new features, we’d love to hear your thoughts. We’ll incorporate your feedback into updated versions.
Ready to try out the dashboard? Log in, play around, and share your thoughts directly from your account. Let us know what you think!