Render-blocking resources can slow down page rendering and create challenges for JavaScript SEO. When search engines struggle to render your content, pages may appear blank or partially loaded, negatively affecting both user experience and rankings. Heavy scripts or CSS only make this problem worse, delaying the time it takes for content to appear.
We’ll explain what render-blocking resources are, why they matter for SEO, and how to effectively eliminate render-blocking resources. We’ll also cover how techniques like prerendering can help ensure your content loads quickly, improves user experience, and ranks better in search results.
What are Render-Blocking Resources?
Render-blocking resources are critical files, usually CSS and JavaScript, that put the rendering process on pause while the client (e.g., a browser or a search bot) downloads, evaluates, and executes them. Until these render-blocking resources are dealt with, the client won’t finish rendering the page. But why are these resources render-blocking? This makes more sense if you understand the rendering process.
What Makes a Resource Render-Blocking?
When you enter a URL in your browser’s address bar, the browser sends a request to that address– basically asking the server for the files needed to construct the page on your screen.
However, websites are just a bunch of files filled with code, which isn’t very helpful for you who just want to access the information on the page.
Using the files sent by the server, the browser can generate a visual representation (rendering) of the HTML, CSS, and JavaScript, providing you with what you actually see on your screen.
The problem begins when you consider the role of CSS and JavaScript files. Although the information you want is – more often than not – in the HTML file, CSS tells the browser how to show these elements, and JavaScript provides functionalities that can also alter the appearance of or information on the page.
Because these two files significantly impact the page’s finished (rendered) version, the browser will stop parsing the HTML as soon as it finds a stylesheet or JS file to fetch and execute them.
Source: flaviocopes.com
In other words, they become render-blocking because they are needed to render the page properly, so the browser stops everything it’s doing before those files are taken care of.
How Render-Blocking Resources Affect Your Core Web Vitals
Core web vitals (CWVs) are metrics used by Google to measure your site’s performance and are part of the page experience signals. Most importantly, Google is now using CWVs to measure site speed, with PageSpeed being a confirmed ranking factor.
Although some of the tactics we’ll be talking about today can help you improve your overall PageSpeed, we’ll focus on the largest contentful paint (LCP) metric, which is the one affected by render-blocking resources. This metric measures the time it takes for the browser to render the largest content on the screen (a.k.a. Above-the-fold content). It’s important because it gives a quick signal to the end user that the page is functioning.
Just imagine this:
You do a search on Google and click on a website, and for several seconds, the page is entirely blank. What’s your first thought? For us: “This page is broken!”. In fact, several studies have shown that 53% of people will bounce off your site after 3 seconds. And that’s what render-blocking resources cause.
If the files are big enough, too many requests are being made, or the code is not optimized, render-blocking resources can delay LCP for several seconds.
Now that we know what’s happening, let’s take care of this issue together!
How to Eliminate Render-Blocking Resources for SPAs and JavaScript Sites
Single-page applications (SPAs) use JavaScript frameworks (e.g., Angular, React, or Vue.js) to load information and dynamically update the page’s content.
Instead of loading separate HTML pages for each interaction or navigation, a SPA dynamically updates the content within the existing page (HTML template) by manipulating the DOM (Document Object Model) using JavaScript without requiring a full page reload.
This provides a smoother and more interactive user experience. Similar to a desktop application.
However, this means that before JavaScript is executed, there’s nothing to show on your page, not even above-the-fold content.
Something similar happens to JS-heavy sites that rely on JavaScript to, for example, update a list of products, show new content, or populate tables of data in real time.
So, how can we handle render-blocking resources without breaking our site?
Step 1: Find the Render-Blocking Resources
The first thing you’ll need to do is identify the resources that are blocking your site’s rendering. Although there are several ways you can do this, let’s focus on the easiest and fastest one: WebPageTest. You can find other render-blocking resource finders in the next part.
Navigate to the tool and paste the URL you want to analyze in the bar.

The test will take a couple of minutes.
Once it’s ready, it’ll provide all sorts of information, including Core Web Vitals scores.
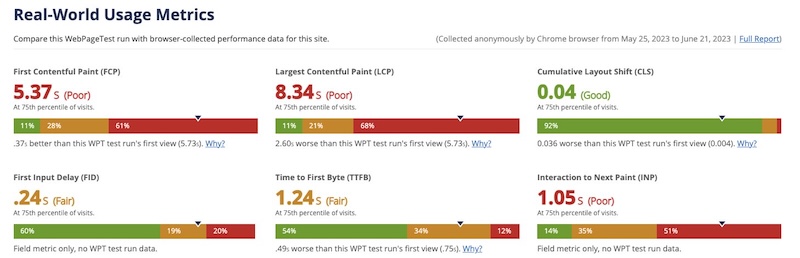
Nevertheless, what you actually care about – in our current case – is the waterfall image. Which shows the rendering process and the resources that needed to be fetched.
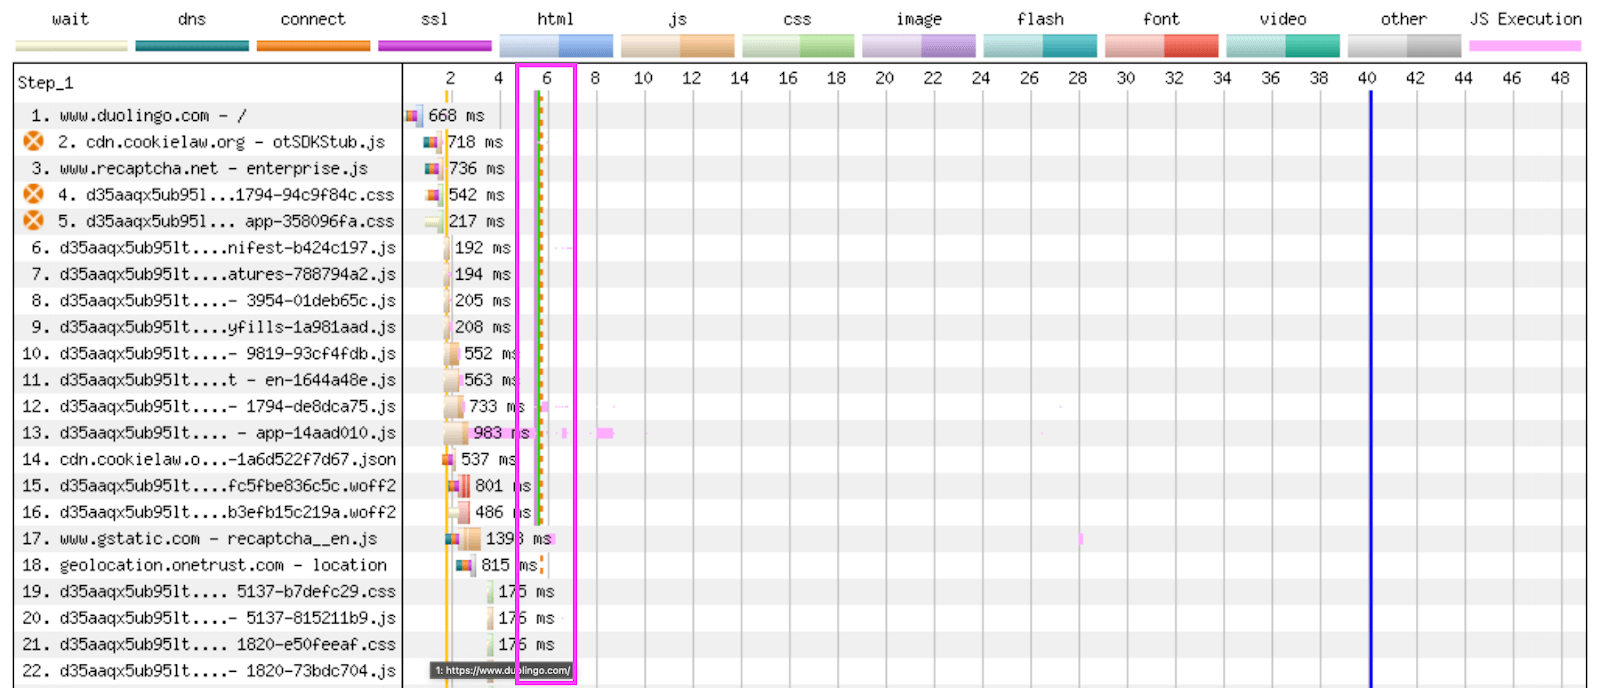
In this waterful, the thin green line represents the “start rendering” point. Any files fetched before the rendering start line (which in the example above starts at 6 seconds) are potential render-blocking resources.
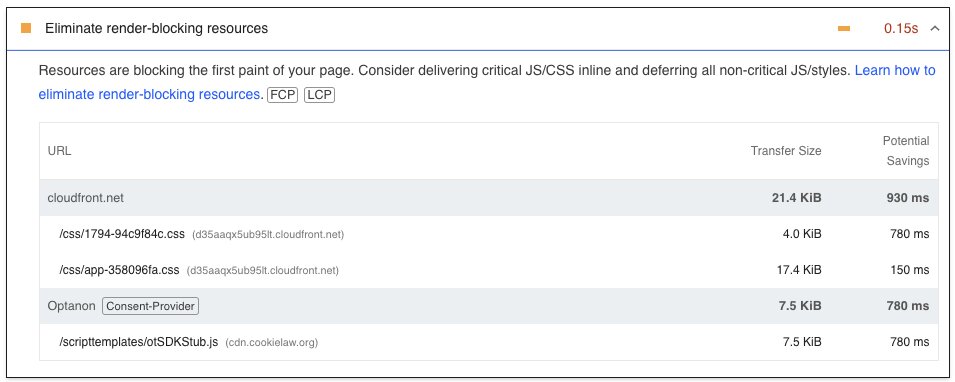
If you want a simpler report to get you started, you can also use PageSpeed Insights, which has a report on render-blocking resources, but it doesn’t show as much information as WebPageTest, so keep that in mind.
Step 2: Identify Critical and Non-Critical Blocked Resources
Once you have the list of resources, it’s time to start testing them.
You want to know which resources are core to your page’s rendering and which add extra functionality but can be dealt with later in the rendering path.
Here’s what we mean. If you go to the DevTools network tab and refresh the page, it’ll record all network activities, and you can see what files are being fetched and when. From there, you can start blocking individual files and see what happens.
For example, if we refresh duolingo.com, here’s how things look:
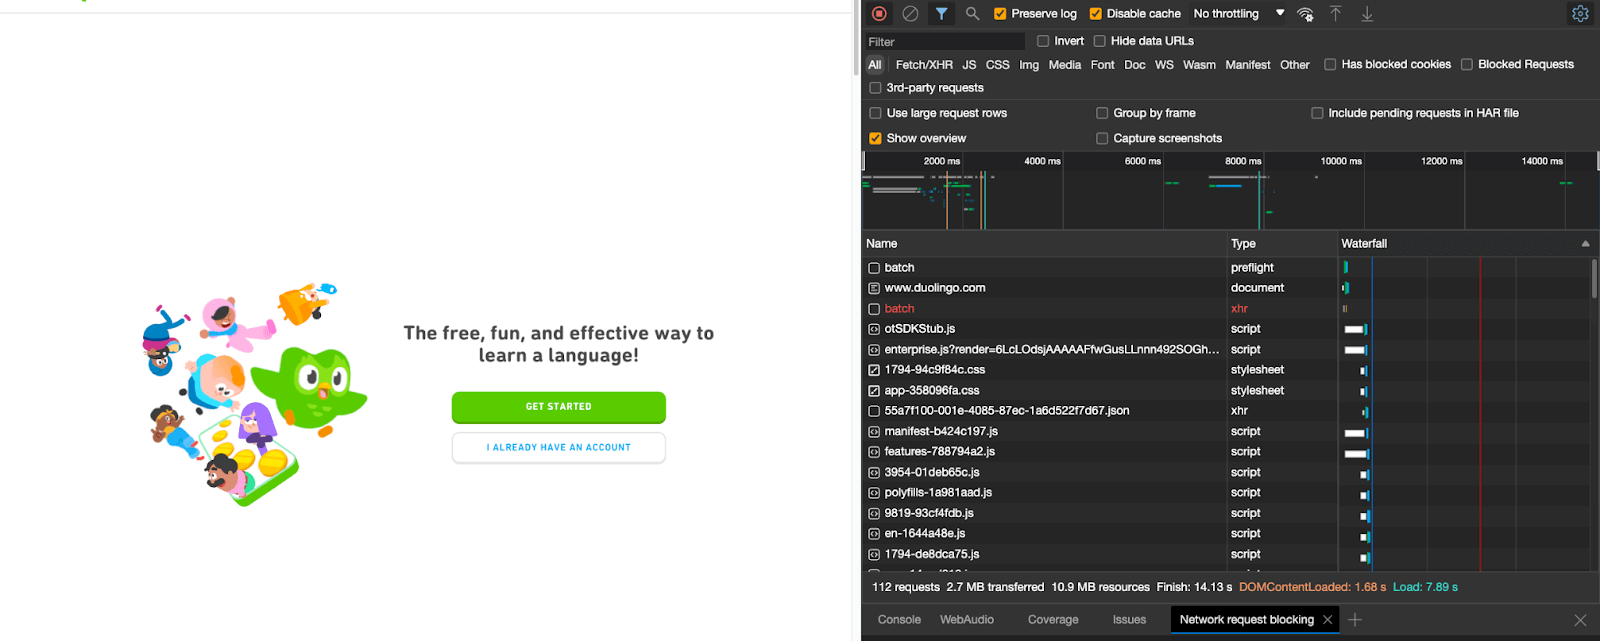
But, if we block the request to “d35aaqx5ub95lt.cloudfront.net/js/manifest-b424c197.js”, nothing renders.
The idea of this exercise is to find critical resources (those required to render the page’s above-the-fold content or main content of the page) which are by nature render-blocking, so we can handle them appropriately.
A. Defer the Non-Critical JavaScript
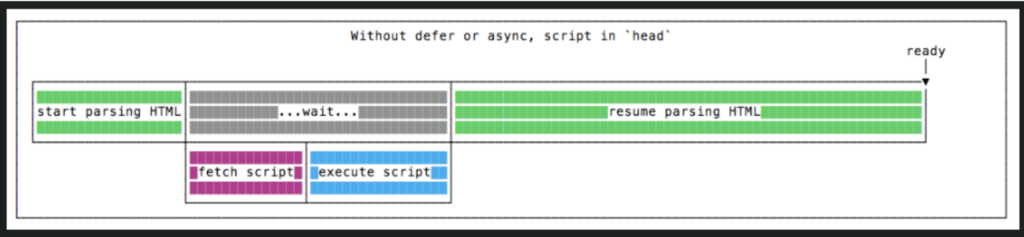
Adding the defer attribute to a script tag tells the browser to download the JavaScript file in parallel (or to fetch it asynchronously) while parsing the HTML, but to wait until the HTML is completely ready before executing.
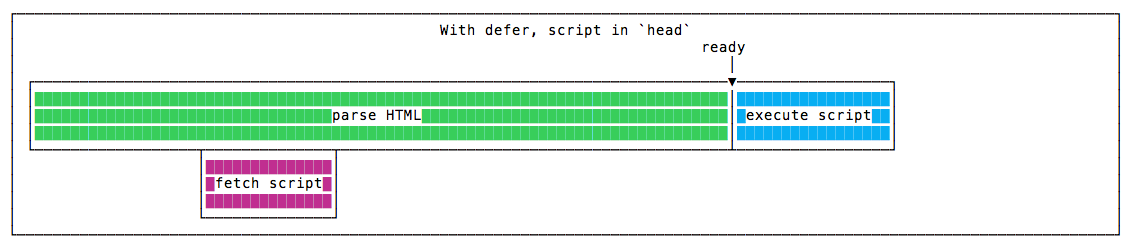
Source: flaviocopes.com
Of course, you don’t want to defer the critical JavaScript. To avoid this, one strategy you can use is code splitting to create and deliver JS in bundles when it’s needed.
That way, you can let the above-the-fold JS render as usual – which is just a fraction of the JS – and defer the non-critical JavaScript, including 3rd-party scripts like analytics.
Single-page applications can do the same with components that are not used on the first painting of the page.
B. Defer Non-Critical CSS
CSS stylesheets can also be deferred to speed up your website’s LCP.
Of course, just like with JavaScript, you should only defer non-critical CSS. Otherwise, you’ll be harming your site in other ways:
1. Without CSS, even though the page will definitely render faster, it will look like a messy combination of text and images without any layout.
This last point is not only terrible for the user experience, but it’s also bad for core web vitals.
Cumulative layout shift (CLS) measures the time it takes for the page to stabilize. Deferring necessary CSS will make your CLS score lower.
However, you can defer those CSS rules that don’t affect your above-the-fold content (improving LCP) and keep render-blocking the CSS rules needed to stabilize your site during the rendering process.
See also: How to Pass Core Web Vitals
C. Inline Critical CSS
Once you have split your CSS and deferred everything that’s not critical, you can also inline above-the-fold CSS to improve your LCP scores even more.
| <!DOCTYPE html> <html> <head> <title>Inline CSS Example</title> <style> /* Inline CSS styles */body { background-color: #f1f1f1;font-family: Arial, sans-serif; } h1 {color: #333; } p {font-size: 16px;color: #666; } </style> </head> <body> <h1>Welcome to My SPA</h1> <p>This is an example of inline CSS in a single-page application.</p> </body> </html> |
This way, you reduce the number of requests needed to render the largest contentful paint.
If you’re unsure what your critical CSS is, use a tool like Critical, which “extracts & inlines critical-path (above-the-fold) CSS from HTML.” Reducing manual work and helping reduce the number of render-blocking resources clients need to deal with.
D. Minify CSS and JS Files
As we’ve said, CSS and JS files are sometimes required to render your page correctly. Still, that doesn’t mean that we should just let them be.
Downloading your files take time, but smaller files take less time. When you minify your files, you are “removing white spaces, deleting comments, using shorter names, and basically stripping out any part of (your) code unnecessary for our machines to run it.”
Note: You could use CSS Minifier and JavaScript Minifier for this.
Minifying and compressing your files will reduce their size considerably, reducing render-blocking time and speeding up your page’s rendering process.
E. Remove Unused CSS and JS Files
There’s nothing worse than resources that block your rendering and then go unused. These resources waste time and hurt your site’s performance without adding any value to the user’s experience.
To identify unused CSS, you can use a tool like PurgeCSS. It has guides for all major JavaScript frameworks. Here’s how the PurgeCSS team describes the tool:
“PurgeCSS analyzes your content and your CSS files. Then it matches the selectors used in your files with the ones in your content files. It removes unused selectors from your CSS, resulting in smaller CSS files.”
Note: It will be very handy if you use any CSS framework like TailwindCSS, Bootstrap, MaterializeCSS, etc.
In the case of JavaScript, the process is very much manual and should be done by someone with experience, or you risk breaking your site.
To identify files you should start optimizing, go to sources > page > coverage in DevTools and refresh the page to begin recording.
In the report, you can see the type and total size of every file downloaded by your browser, and then, it will provide the size of unused code downloaded – in the visualization, it is represented by the red bar.
For example, from the main JS file we disabled earlier, 54% went unused when rendering the page.
Reducing this number – or at least splitting it to defer the unused code – will make a significant improvement.
Step 3: Preload or Load Locally External Fonts
External fonts called from the head section – or even within a stylesheet – are also considered render-blocking resources and can take a toll on your site’s performance. This mainly happens because external fonts are bloated with several variants you won’t use.
Similar to other resources, we can tell the browser to download this asset asynchronously using the <link rel=”preload”> “which will trigger a request for the WebFont early in the critical rendering path” without pausing the rendering of other elements.
Here’s a complete guide on optimizing WebFonts rendering and avoiding periods of invisible fonts.
Another solution – and the one we think it’s the best – is to load your fonts locally:
1. Obtain the font files – You need to have the font files in the appropriate format (preferably .woff, .woff2) for web usage.
2. Include the font files in your project – Place the font files in a directory within your project’s file structure. It’s common to create a “fonts” directory at the root level of your project or within your assets folder.
3. Define the @font-face rule – Open your CSS file or style block and use the @font-face rule to define the custom font. Specify the font-family name, font file paths, and other relevant descriptors. Here’s an example:
| @font-face {font-family: ‘CustomFont’;src: url(‘fonts/CustomFont-Regular.ttf’) format(‘truetype’);font-weight: normal;font-style: normal;} |
Note: Make sure to adjust the url() path based on the location of your font files within the project.
4. Apply the custom font – Once you’ve defined the @font-face rule, you can apply the custom font to specific elements in your CSS code. Use the font-family property and set it to the name you specified in the @font-face rule.
| body {font-family: ‘CustomFont’, Arial, sans-serif;} |
Step 4: Generate a Snapshot for Search Engines with Prerender.io
After implementing the previous strategies, you’ll see a considerable improvement in performance and LCP scores, and your customers will thank you for it.
However, there’s a big difference between how your end user’s browser and Google handle JavaScript.
How Google Renders Your Page
When your customer navigates to your site, her device has an entire CPU to use in the rendering process, and if it’s connected to a high-speed wifi connection, it can handle rendering even faster.
On the other hand, when Googlebot navigates to your site, it first needs to crawl the page to find all the resources required to render your page. If it’s just HTML and CSS, then there’s no problem. Googlebot can easily render your page and see your content.
In this scenario, everything we’ve done to improve your page’s CSS will return a positive ROI.
But if it finds a JavaScript file, the crawler will send all resources to the Renderer to process the JS and start the rendering process.
The problem is that Google is more than just crawling your site. It’s crawling and trying to render millions of websites monthly, so resources are scarce. In most cases, it can take 9x times longer for Google to crawl a JS site.
In fact, Google has suggested for years to use other rendering techniques to take the rendering step off their shoulders and ensure its crawler can access your content thoroughly.
In other words, there’s a cap on how well and fast Google can render your JavaScript content, no matter how well-optimized it is—putting a cap also on your core web vitals scores.
Solving JavaScript SEO with Prerender.io
In simple terms, Prerender is a tool designed to help overcome the limitations of search engines so you can focus on user experience instead of optimizations for search bots.
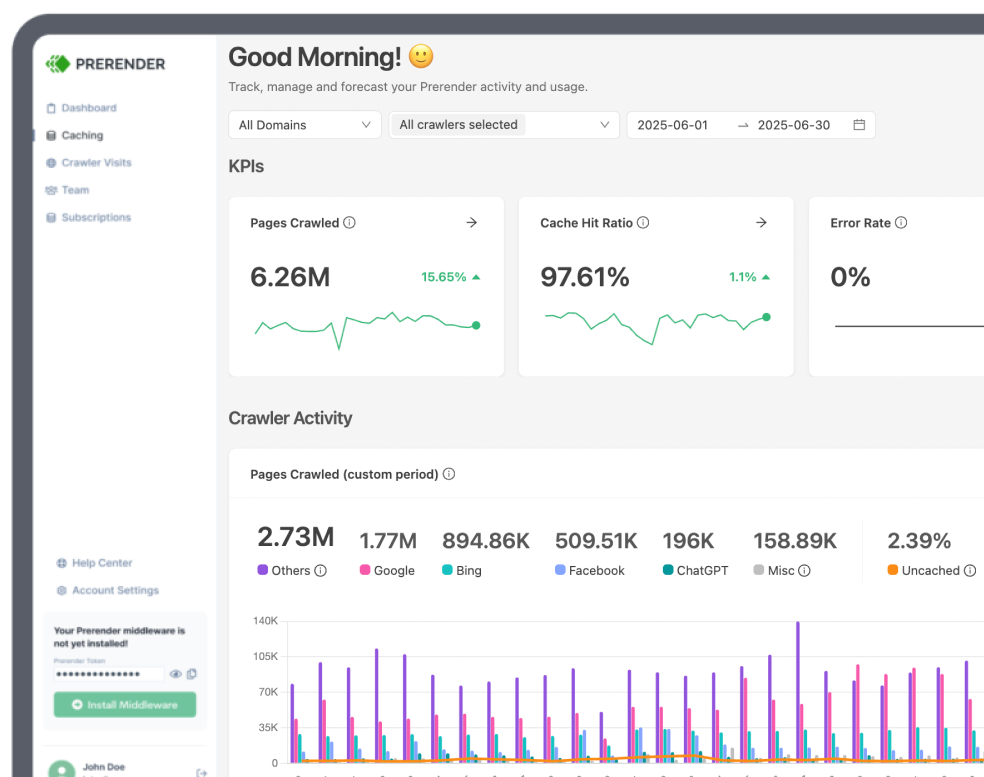
After installing Prerender’s middleware, you can submit a sitemap through your dashboard, and Prerender will crawl your pages.
For each page, it’ll generate a fully rendered, stable, and functional version of your page and cache it as a snapshot. Then, when a search bot (or any other bot you specified) request your page, Prerender will identify the bot and send the snapshot instead.
This snapshot is wholly rendered, including 3rd-party scripts, and it’s delivered in 0.03 seconds on average – pushing your CWVs and server response scores to near perfect.
Using Prerender will save you time and money by reducing the hours of work required to implement other solutions like server-side rendering. For example, see how leading running shoe brand On saves millions per year by using Prerender.
This is because Prerender helps you fix render-blocking resource issues from their root and improve your site’s indexation rate and speed.
Tools to Identify Render-Blocking Resources
You can’t eliminate what you haven’t caught red-handed. Before you start rewriting code or shuffling files, you need to know which scripts and styles are actually holding up the first paint. These render-blocking resource diagnostic tools put the offenders on display.
Google PageSpeed Insights
Google PageSpeed Insights (PSI) helps you test URLs. Once you paste a URL and click Analyze, PSI gives you two scorecards formobile and desktop, plus a red-yellow-green list of every CSS or JS file delaying First Contentful Paint (FCP) and Largest Contentful Paint (LCP).
PSI quantifies the pain (in seconds) and ranks the culprits by impact, so you can know which file slashes the most latency and tackle the worst first.
Lighthouse (built into Chrome DevTools)
With Lighthouse, you can also test pages to see what’s blocking their rendering path. Just open the page you want to test, press F12, choose Lighthouse → Analyze, and wait a few seconds. In the Diagnostics section, you’ll see a row labeled Avoid render-blocking resources with two critical data points:
Total Blocking Time (TBT) – the combined milliseconds during which the main thread is blocked, preventing the page from responding to user input. A high TBT often signals large or inefficient CSS/JS files that stall First Input Delay (FID) and slow down interactivity.
Sorted file list – every blocking script or stylesheet is listed in descending order of impact, so the worst offenders float to the top. This makes it easy to identify which files to inline, defer, or remove first.
Because Lighthouse runs entirely in your browser, you can dial the Network and CPU throttling sliders to emulate 3G, 4G, or a low-end device. Rerun the audit under each profile to see how render-blocking files multiply latency in real-world conditions, quantify potential savings, and validate fixes before pushing them to production.
WebPageTest Waterfall
With this tool, you can simply paste a URL, choose a test location, and click Start Test. WebPageTest returns a color-coded waterfall that shows how every HTML, CSS, JS, font, and image file loads, frame by frame. Any request that halts parsing is highlighted in purple, so render-blocking resources stand out instantly.
Scrub the timeline to pinpoint the exact millisecond where the page freezes, then capture that view for stakeholders. Turn on Filmstrip and go to Visual Progress to watch the page paint in 0.1-second snapshots; each blank frame represents render-blocking time you can eliminate.
GTmetrix
GTmetrix feels like handing your site to a pit crew and watching them tear it down in slow-motion. Enter a URL, choose a test location, and click Test. GTmetrix loads the page in a real Chrome browser, runs Lighthouse plus YSlow checks, and returns two key scores: Performance and Structure.
In the Structure tab, the Critical Request Chains diagram shows which CSS or JS files block rendering. Optimize or defer the first file in any chain to free everything behind it and cut seconds off First Contentful Paint.
The Waterfall tab helps you see each network request in color-coded bars, with redirect hops appearing in bright orange. Every extra hop adds roughly 300 ms, so you can quickly spot and fix unnecessary www/non-www loops or CDN misroutes. Use these details as a repair guide, rerun the test, and confirm faster load times as red bars turn green.
Resolve Render-Blocking Resources with Ease
In the end, render-blocking resources are necessary files and code to render your pages properly.
Your objective is to control how and when these resources are dealt with to avoid putting above-the-fold content on pause (LCP) without hurting other UX metrics like first input delay (FID) or cumulative layout shift (CLS).
Before doing any drastic change – like deleting a piece of code or referring to an entire JS file – make sure to test your site’s behavior with them disabled.
If you’re working on a SPA or an enterprise site, one of the best first steps is installing Prerender. Trusted by 100k+ leading brands and an industry standard since 2014, you can enjoy a free 30-day trial to see for yourself.
This will allow you to start competing in search results and see your SEO campaign in action while your team optimizes your critical rendering path to improve user experience and conversions.
Want to learn more about improving site performance? Check out these guides: