Unable to figure out why your pages aren’t getting indexed by Google?
It could be low crawl budget efficiency.
Although it isn’t a problem for most sites, it can be for those that heavily rely on JavaScript to inject content or add functionality. In a JS case, crawl budget waste can break your SEO efforts.
So, in this article, we’ll explore how to detect crawl budget issues by analyzing one of the most important files we have at our disposal: log files.
What is a Log File?
Log files or server log files are files meant to store servers’ activities to provide an unfiltered record of everything happening behind the scenes. Several log file types are available, but for SEOs, the most important one is the “access log file.”
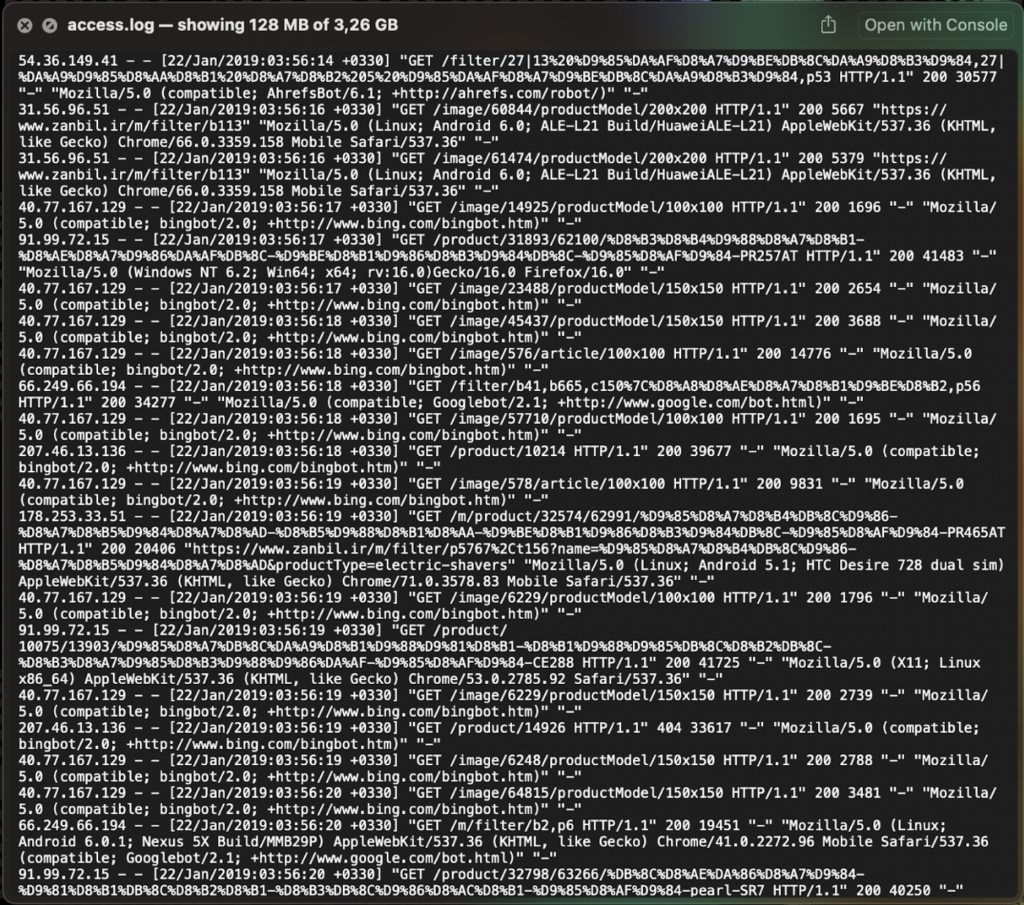
The access log file is a record of all HTTP requests made to the server.
It provides detailed information like the user-agent, request type, status code returned, URL requested (including images and resource files), and more for each request made to the server.
What is Log File Analysis?
As you can imagine, in SEO, we call log file analysis the act of getting insights out of access log files.
This is mostly done with the objective of understanding search engine behavior like:
- How often is your site getting crawled?
- Are search engines crawling irrelevant pages, wasting crawl budget? (e.g., pages returning 404 and 500 error codes)
- How often are specific pages, page types, or web sections getting crawled?
- Are there important pages not getting crawled?
With the right questions in mind, you can find a lot of useful information within log files. Still, small static websites shouldn’t be spending too much time on log file analysis, as the benefits are more significant for enterprise-level and dynamic websites, where optimizing crawling can result in big SEO gains.
5 Ways to Use Log File Analysis to Optimize Your Crawl Budget
In simple terms, your crawl budget is the number of pages from your site search bots can visit in a specific period of time (session) – this is determined by several factors like the way your website is structured, server response times, page speed, rendering, etc.
Resource: 7 Key Factors that Influence Your Crawl Budget
Because crawl budget is finite, the larger and more changing your site is, the more important it is to keep a close eye on where is your budget being spent. When wasted, crawl budget issues can result in:
- Long indexation delays – it can take weeks or even months before new content and key landing pages (e.g., product pages) get indexed as search engines can’t get to those pages fast enough.
- Low rankings – fewer pages indexed means you’re losing important ranking factors, making your site look less authoritative or relevant than it actually is.
- Undiscovered URLs – when your budget is being used to crawl 404 pages, redirect loops, or irrelevant (for SEO) pages, it can get depleted before getting into the important pages.
So how can we use log file analysis to prevent all of these roadblocks? Note: If you don’t have access to log file data, but you’d like to get some practice, you can use this e-commerce log file from Kaggle.
1. Deal with Error Pages Wasting Crawl Budget
Pages returning 4XX and 5XX status codes do not provide any value to your site.
In fact, if search bots are crawling these pages too often, it can hurt your site’s quality, signaling to Google that your site is under-optimized.
Although there are many roads you can take, a good place to start is with Screaming Frog’s log analyzer.
Once you have your log file, you can just drag and drop it into the tool, and it’ll start processing.
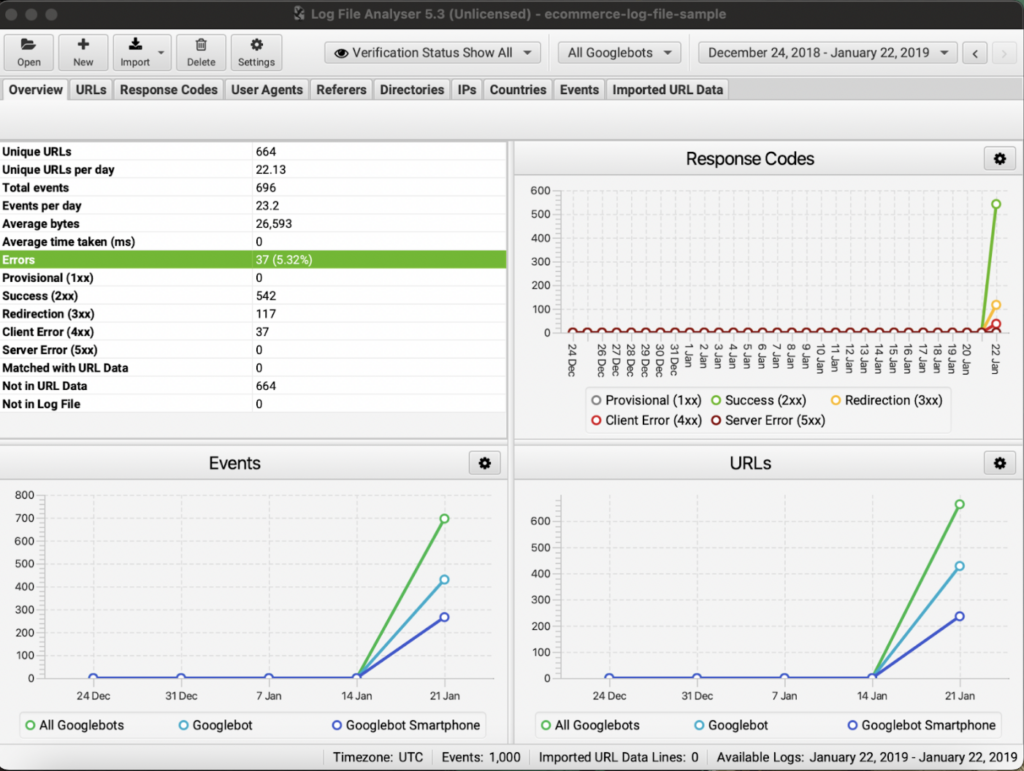
Once the data is in, you can go to the response code tab and filter by status code.
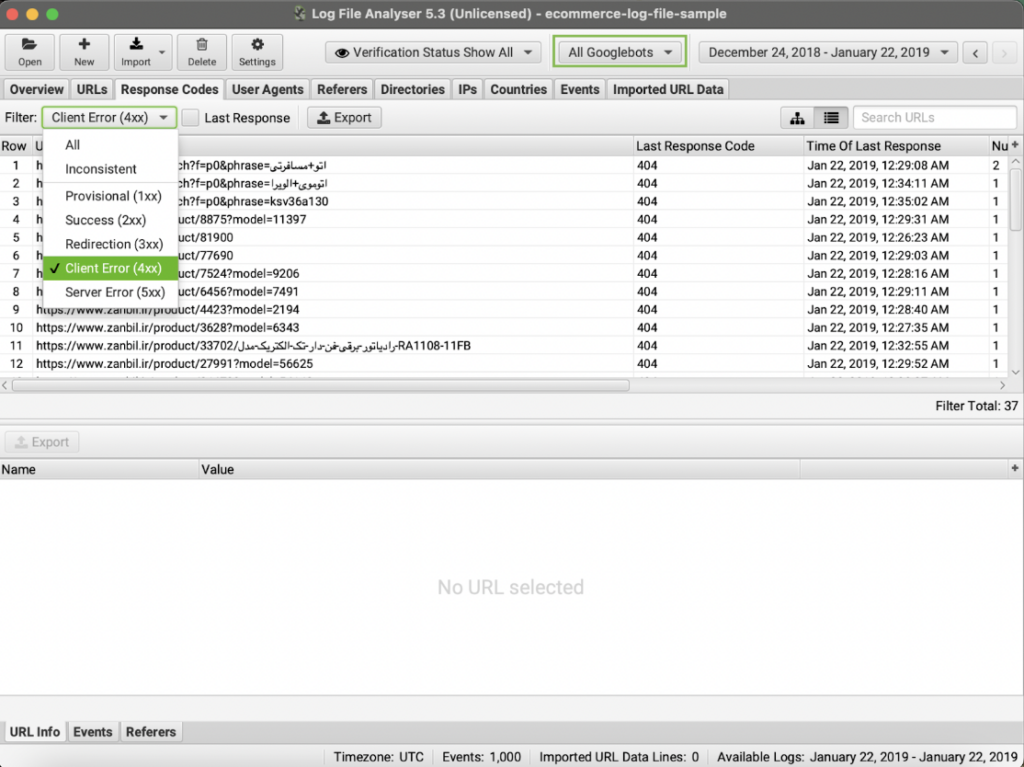
This will show you all pages returning the status code – also, notice you can choose if you want to see only the pages that were hit by a specific search bot.
Now, you can export all this data to a CSV for further analysis.
Dealing with error pages that are being consistently crawled is an easy way to get more out of your existing crawl budget, as this is budget you’ve already gain but is getting wasted.
Pro Tip: You can also import URL data (e.g., a crawl you’ve done recently) to add more context to the information shown in the log file. You can add as much data as you need to this report as long as it matches the URL within the log file. For example, adding search data from an SEO tool can let you find the most important pages from the log file to focus on them first.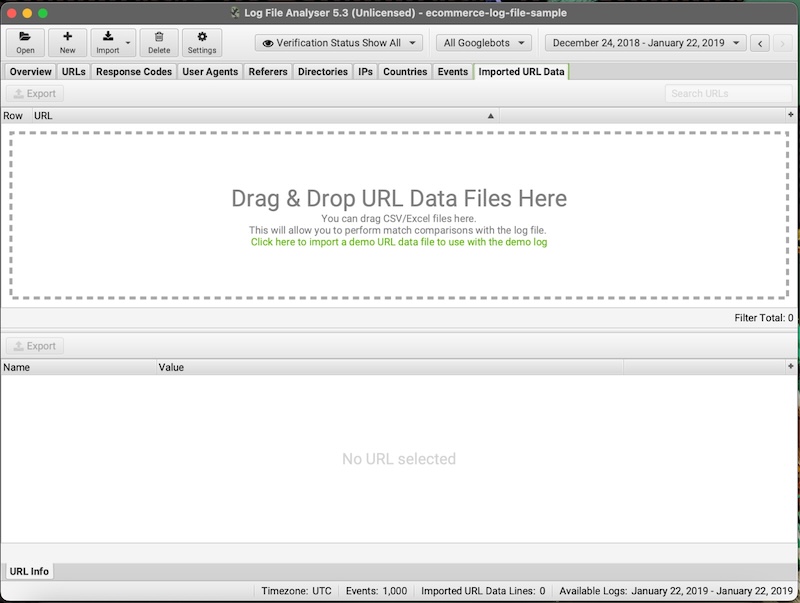 |
2. Discover How Long It Takes for Google to Find Your New URLs
Server records (log files) can also help you understand how easy it is for search engines to find new URLs and benchmark how long they take to discover them.
- Take note of the date you published your new URL.
- Monitor your log file to find when a Google user-agent hits your URL for the first time – this is the first step for indexation, so the faster your URL gets discovered, the better.
- For a better measure, also monitor how long it takes for your page to get indexed after it was first crawled.
Keeping track of these two events will help you better understand how smooth the crawling and indexing process is. For example, you could also keep track of the times the page gets crawled before being indexed, especially if the page uses JavaScript.
If Google needs to visit the page too many times before the page is indexed – delaying the process by weeks or months – or worse, the page is getting crawled regularly, but it’s not getting indexed, it means there’s a potential rendering issue.
Note: Another scenario is your page not getting crawled after several weeks, which can be a signal for crawling issues like poor site architecture or maybe the page isn’t in the sitemap.
On the other hand, you can also use this test to measure the effectiveness of your optimizations. Let’s say you’ve taken a few months to improve the internal linking within your blog posts and pillar pages. If new URLs are crawled for the first time in a shorter period of time than before, it’s a clear indication of success.
3. Find Non-Indexable Pages Getting Crawled
There are many reasons why pages are set to noIndex. However, in some cases, important pages can be tagged as noIndex because of human error – very common after site migrations.
So first, crawl your site to find all pages tagged as no-index and ensure there are no important pages getting ignored by mistake. Once you have fixed any issues found, import this crawl data into your log analyzer to find which of these non-indexable pages are getting crawled.
After getting your list ready, it’s time to make a decision:
- If the page is set to noIndex, but it’s getting discovered through external links, it’s a good idea to change the tag to index, as there’s search value to the page (otherwise, people wouldn’t be linking to it), and you can take advantage of the backlinks to pass link juice to others — noIndex, follow pages do not pass PageRank.
- If the page doesn’t have any search value nor it has relevant backlinks, you might want to block the page from getting crawled using the robot.txt file — do not block resources like JS or CSS files, as this could disrupt your site’s rendering and hurt your indexability.
Resource: Robot.txt SEO: Best Practices, Common Problems & Solutions
- If the page is canonicalized and it has a high crawl rate, you might consider blocking it as canonicalized pages won’t appear on search results.
Limiting the number of unnecessary pages being crawled will help you use your crawl budget more efficiently.
4. Spot Crawl Down Trends and Prevent Bigger Issues
Monitoring your log files it’s a great way to detect potential issues before they become a widespread problem across the site.
For example, by taking a closer look at the following metrics, you can spot trends like unstable URLs:

These are the number of times the URL has returned each status code. This is important because if a URL has been consistently working (2XX status code) but is suddenly returning a 4XX or 5XX message, it can be a clue to a larger issue.
You can also discover URLs that used to be crawled every three days are now only being crawled every two weeks. This drop in crawl rate can signal an internal link issue or a drop in relevancy in Google’s eyes.
Note: Keep in mind that how often your URL is crawled will depend on several factors including how often the content change. The problem isn’t whether or not the URL is crawled frequently but a decrease in the usual crawl frequency.
5. Identify Slow Pages
One of the key factors influencing your crawl budget is page speed, and you can measure this in two metrics within your log file analysis:
- Average Bytes – the average size in bytes of all log events for the URL.
- Average Response Time (ms) – The length of time taken (measured in milliseconds) to download the URL on average.
But are these metrics important?
If we understand crawl budget as the total number of pages a search bot can crawl in X period of time, then we could say that the time it takes to crawl (download all necessary files and resources to build a page) a URL is the amount of crawl budget it consumes.
To put this into perspective, let’s assume that Google assigns 20 minutes to crawl your site:
- If you have 100 pages, each taking 12 seconds to crawl, then Google should be able to crawl all your URLs within one 20-minute session.
- But if every page takes 20 seconds to crawl, now you have a crawl budget issue, as there’s not enough budget to crawl the entire site.
This is a very simplified way of thinking about crawl budget, but the core idea is valid. Pages with large file size or that are too slow to load will consume more crawl budget.
By identifying pages that meet any of the problems above, you can create an optimization strategy to speed up your server, reduce page file size and optimize static resources to load faster.
Wrapping Up
Log files are a gold mine of information we can use to optimize our site’s crawl budget, identify potential issues and bottlenecks before they become a site-wide problem or benchmark your initiatives to find out what works.
However, this is easier said than done. Optimizing your pages at scale can be time-consuming, resource intensive, and complex, to say the least.
Large websites and single-page applications (SPAs) rely on JavaScript to provide a top-notch user experience. Still, JS force search engines to perform an extra layer of rendering, which takes 9x times longer to crawl, and the process isn’t without flaws.
In fact, most search engines can’t handle JavaScript, and those that do – Google and Bing – suggest using alternative rendering strategies to take the burden off their shoulders and avoid indexing issues.
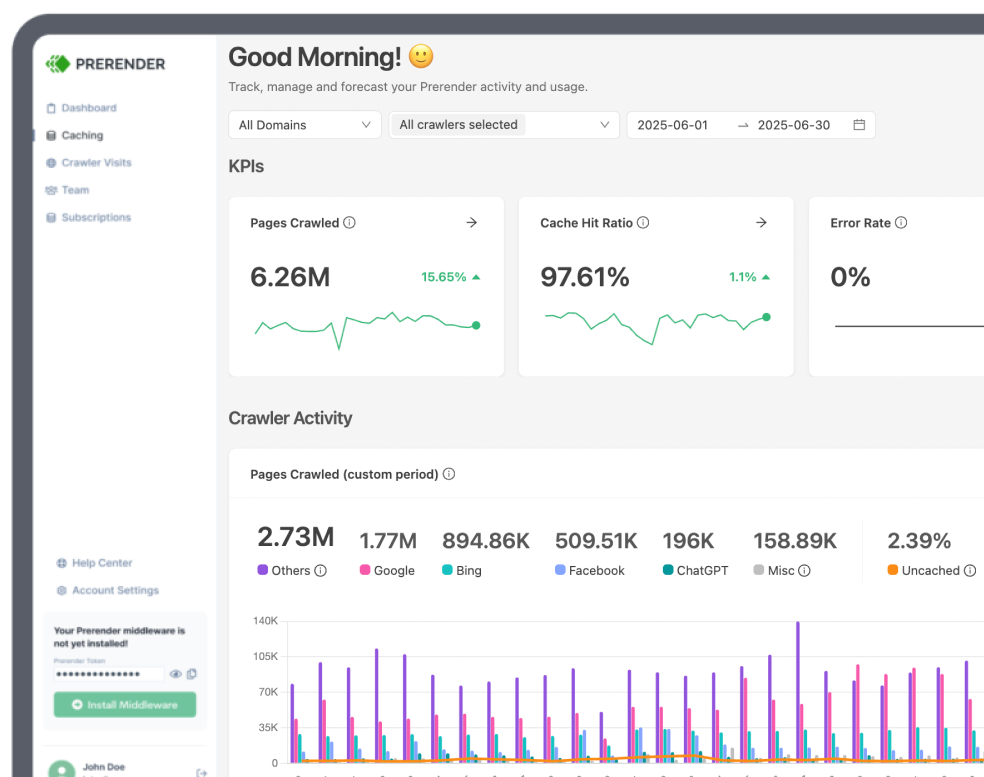
If you are struggling to improve your crawl budget and efficiency in a scalable, automatized way, then you need to start using Prerender.
Prerender crawls your site and caches a fully rendered and functional version of your pages. Whenever a search bot requests your pages, Prerender will deliver the cached version in 0.03s average, allowing search engines to crawl your site faster without having to deal with any bottleneck.
Even better, this signals to search engines that your server can handle a more frequent and larger number of requests, increasing your crawl budget and index rate.
Learn how Prerender works in detail, or join 100k+ businesses worldwide and try it for free today.
To learn about more about crawl budget optimization and how to avoid indexing hiccups, here are some free resources: