JavaScript rendering problems rarely announce themselves as rendering problems. Instead, they show up as familiar technical SEO issues: pages stuck in “Crawled, currently not indexed,” outdated product snippets, or your brand missing from AI search results. Because those symptoms have obvious, well-worn explanations, teams blame content quality, backlinks, or an algorithm update instead of the rendering layer.
For websites built on modern JavaScript frameworks (like React, Vue, Next.js, Astro, etc.), that misdiagnosis costs months of wasted optimization while the real problem becomes lost traffic, leads, and revenue.
In this article, our expert team at Prerender.io discusses 10 signs that rendering issues are hurting your visibility, shows you how to confirm each one, and explains how to fix JavaScript rendering issues at the rendering layer.
TL;DR: Indications That Your Website Has Rendering Issues
- JavaScript rendering problems occur when your server sends crawlers an HTML shell and relies on the browser to render the content, so crawlers see an empty page while users see a complete one.
- These problems usually surface as ordinary SEO issues rather than obvious rendering failures, which is why they go undiagnosed for months.
- Common warning signs include unindexed pages, blank rendered HTML, missing schema, deceptively fast crawl stats, unfollowed internal links, rendering errors and false soft 404s, AI search invisibility, broken social previews, Google Ads disapprovals, and Core Web Vitals spikes.
- All ten share one root cause: a broken rendering layer, where bots receive an empty or incomplete version of pages that look perfect to human visitors.
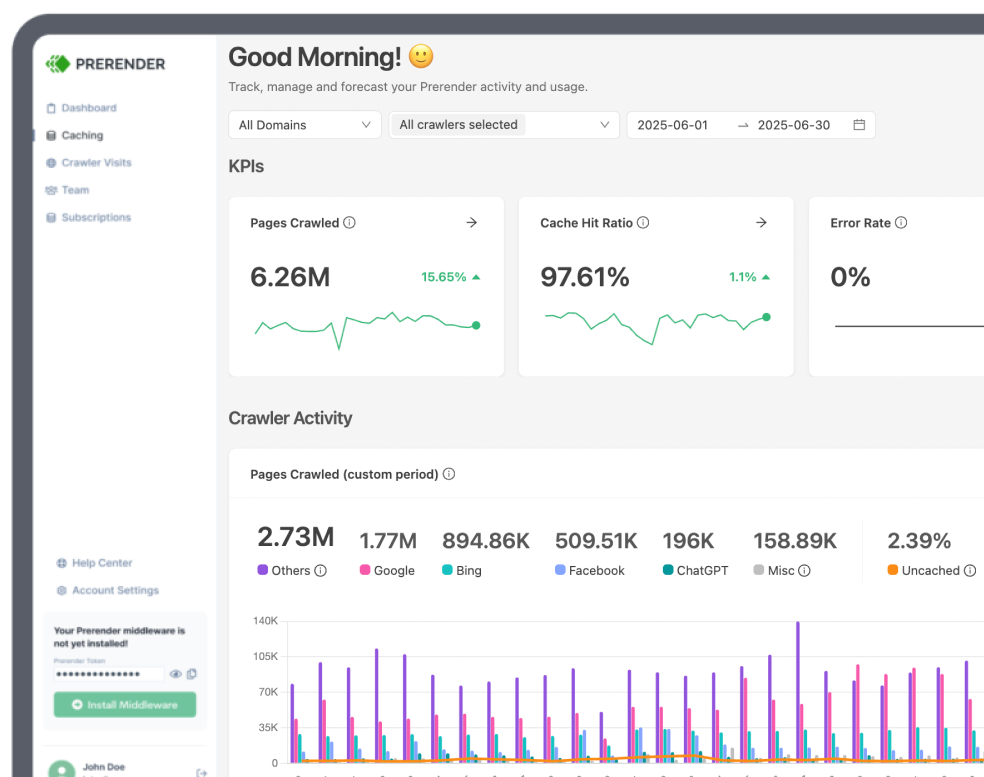
- Prerender.io closes the rendering gap by serving crawlers fully rendered HTML, without requiring a site rebuild.
Why JavaScript Rendering Problems Are Hard to Spot
JavaScript rendering problems are difficult to diagnose because your site appears healthy from a user’s perspective. Pages load in the browser, visitors can navigate the site and complete purchases, and internal dashboards continue to report healthy performance. Meanwhile, search engines and AI crawlers are receiving incomplete HTML, leaving important content unavailable for indexing.
When the symptoms finally appear, teams often investigate the wrong causes. Indexation drops get attributed to algorithm updates or thin content, missing rich results are blamed on schema implementation, and inconsistent AI visibility gets written off as LLMs being unreliable. Every one of those explanations is plausible, which is why rendering rarely gets checked. The evidence exists in exactly one place: the HTML your server sends before any JavaScript runs.
So, if your site is built with React, Vue, Angular, client-rendered Next.js, Bolt.new, or another JavaScript framework, and several of the signs below look familiar, JavaScript rendering is the most likely cause.
10 Signs Your Website Has JavaScript Rendering Problems
Each sign below indicates that bots are receiving less content than your visitors do. One issue alone could have another explanation, but multiple symptoms on your JS-heavy site strongly suggest a rendering problem.
1. Google Search Console Shows Pages Stuck in “Discovered’ or “Crawled – Currently Not Indexed”
These two Google Search Console (GSC) statuses are the most common early warning of JavaScript rendering issues, and the mechanism behind them is Google’s two-wave rendering process (crawling the raw HTML first, then rendering the JavaScript later as computing resources become available).
- “Discovered – currently not indexed” means Google knows the page exists but has delayed crawling it.
- “Crawled – currently not indexed” means Google fetched the raw HTML, found a near-empty shell, and pushed the page into the slow rendering queue, where JS-dependent pages can sit for weeks or months.
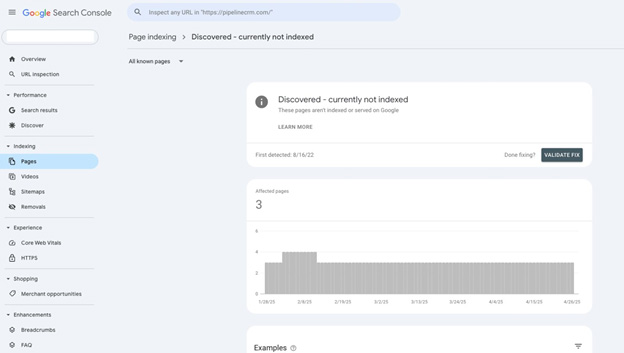
How to spot it: Open the Page Indexing report in Google Search Console and review how many URLs fall into these two categories. A growing count on a JS-heavy site is a strong signal.
2. Your URL Inspection Live Test Shows Blank Rendered HTML
The URL Inspection live test shows the exact HTML Google uses; if that view is a blank screen, a loading skeleton, or raw template brackets like {page.title} instead of real content, crawlers are evaluating an empty page. Single-page applications (like Lovable) are especially prone to returning an empty shell that depends on JavaScript to populate the page.
The damage extends beyond visible content. When titles, canonical tags, or hreflang tags are injected client-side by JavaScript, Google may miss those signals during its initial crawl.
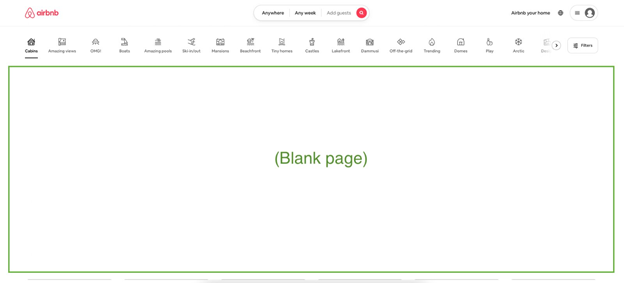
How to spot it: Run URL Inspection in GSC, click “Test live URL,” then view the rendered HTML. Search for visible page copy and confirm that important metadata appears in the HTML. If those elements are visible in your browser but missing from the rendered HTML, JavaScript rendering is likely preventing Google from seeing the complete page.
Related: How To Make Your Lovable Website SEO-Friendly.
3. Google is Missing Your Structured Data or Schema Markup Despite Correct Implementation
Many JavaScript sites inject JSON-LD schema through Google Tag Manager or client-side scripts. Although the markup may validate successfully in testing tools, Google may still fail to generate rich results if the structured data isn’t consistently available in the raw HTML when the page is crawled.
How to spot it: Compare your page source (right-click, View Source) against what the Rich Results Test or the GSC Enhancements reports detect on the live URL. If your schema appears correctly in your implementation but Google behaves as though it doesn’t exist, client-side injection may be the problem.
Our guide to schema markup for dynamic websites covers implementations that remain accessible during crawling.
4. GSC Crawl Stats Show a Fast Average Response Time While Indexation Tanks
At first glance, this combination looks like good news. Client-side rendered (CSR) sites often report response times under 200ms, because the server hands over a tiny, near-empty file instantly.
But that file contains little meaningful content, so Google still has to spend additional resources rendering the page before it can evaluate it. That extra processing drains crawl budget, slows page discovery, and reduces indexing efficiency.
How to spot it: Open GSC → Settings → Crawl Stats and compare the average response time with your sitemap count and page discovery rates. Fast response times paired with declining indexation indicate that Google is receiving lightweight HTML.
5. Internal Links Are Not Being Followed, and New Content Takes Weeks to Appear in Search
When internal links exist only after JavaScript runs, Googlebot will not discover them until the rendering stage, delaying how quickly it can understand your site’s structure and find new pages. New URLs then wait on sitemaps and the rendering queue for discovery, while your competitors with accessible links get discovered more efficiently.
How to spot it: Compare View Source (the HTML your server sends) with Inspect Element (the page after JavaScript runs) in Chrome DevTools. For a broader audit, crawl your site in Screaming Frog with JavaScript disabled and enabled, then compare the internal link reports.
6. Googlebot Triggers Blocked Resources, JS Console Errors, or False Soft 404s During Rendering
Rendering problems don’t always stem from missing content. A robots.txt rule blocking a critical script, an API request that times out, or a JavaScript error can leave Googlebot with an incomplete page. When that happens, Google may struggle to understand the page correctly and, in some cases, classify it as a soft 404 because the rendered content appears too thin, despite the page returning a normal HTTP status.
How to spot it: Open GSC URL Inspection → Live Test → View Tested Page → More Info tab to review blocked resources and JavaScript errors. Also, check the Page Indexing report for unexpected soft 404s. If your browser shows a working page but Google doesn’t, rendering is likely the point of failure.
7. AI Search Engines Hallucinate or Completely Omit Your Brand Content
Unlike Google, many AI search crawlers, such as GPTBot, PerplexityBot, and ClaudeBot, currently don’t execute JavaScript. They read the raw HTML your server returns and nothing more. If your content isn’t in the raw HTML, it doesn’t exist to an AI crawler. So they omit your brand from answers, cite competitors instead, or answer with outdated information.
Google’s AI shows failures differently, but boils down to the same thing. AI Overviews and Gemini draw on Google’s index, so pages stuck in the rendering queue simply aren’t available to be summarized yet.
Missing structured data can make this problem worse. When schema isn’t available in the initial HTML, AI systems lose another valuable source of machine-readable context for understanding your products and content, costing you AI citations.
How to spot it: Ask LLMs direct questions about your products, pricing, or features. Wrong answers, outdated information, or competitor citations on queries you should own all suggest that AI crawlers cannot access your pages. You can also review your server logs to confirm how AI bot user agents are accessing your site.
8. Social Media Link Previews Appear Blank, Broken, or Stale
Most social platforms don’t execute JavaScript when generating link previews. When someone shares your URL on LinkedIn, X, Slack, or WhatsApp, the platform’s bot fetches the page once and reads the Open Graph tags available in the initial HTML. If those tags are injected only after JavaScript runs, shared links display missing images, incorrect titles, or no preview at all, reducing engagement before anyone even clicks.
How to spot it: Paste a page URL into Facebook Sharing Debugger, LinkedIn’s Post Inspector, or X Card Validator. Missing images or incorrect metadata indicate your OG tags aren’t present in the HTML served to crawlers.
Related: How to Fix Broken Social Media Link Previews.
9. Google Ads Quality Scores Drop or Campaigns Get “Destination Not Working” Disapprovals
Google Ads bot burns its crawl resources on unrenderable JS pages, as Googlebot does in sign 4, then concludes the landing page is broken. This results in a “Destination not working” disapproval on a page that loads perfectly, or a lower landing page experience score, which increases cost per click. Unfortunately, teams rarely suspect rendering here because the ad platform frames everything as a page-quality issue.
How to spot it: Review the Google Ads Policy Manager for ‘Destination not working’ disapprovals, and check the Quality Score column for ‘Below average’ landing page experience ratings. If the flagged pages work fine for users but rely heavily on client-side rendering, the rendering layer may be a possible cause. Our guide on fixing disapproved Google Ads explains the recovery process.
10. Core Web Vitals Show Sudden Spikes in LCP and INP
The final sign is the one place where the rendering burden also touches real users. JavaScript-heavy websites often require the browser to download and execute significant amounts of JavaScript before displaying meaningful content. That extra work can delay Largest Contentful Paint (LCP) and increase Interaction to Next Paint (INP) through long-running JS tasks.
How to spot it: Test important pages in PageSpeed Insights and compare the results with the Core Web Vitals report in Google Search Console. If LCP delays or poor INP scores are largely driven by JavaScript execution, your rendering architecture may be contributing to those performance issues. Prerendering resolves both at the source by delivering complete HTML to crawlers.
What All These JavaScript Rendering Issues Have in Common
Every sign above points to the same underlying problem: crawlers aren’t evaluating the same version of your pages that human visitors see. Users get a fully rendered experience in the browser. Search engines, AI crawlers, social platforms, and ad bots get the initial HTML response, and if that response is incomplete, the content, metadata, and structured data they need simply aren’t there.
So the fix isn’t more content, more links, or waiting out an algorithm update. It’s the rendering layer—one fix for all ten issues.
How to Fix JavaScript Rendering Problems
There are two primary ways to solve the rendering problems.
The first is changing how your site renders pages through JavaScript SEO best practices, such as server-side rendering (SSR) or static site generation (SSG). These are effective long-term solutions, especially for teams already planning a framework migration or major site rebuild, but they demand significant engineering time and resources.
However, if you need bots and search engines to see your complete pages without rebuilding anything, an SEO prerendering infrastructure like Prerender.io is the practical route.
Prerender.io renders each page in the background, waits for the JavaScript to finish loading, and serves the resulting HTML to crawlers while human visitors continue receiving the normal JavaScript experience.
With the rendering gap removed, search engines can index complete content on the first crawl, structured data becomes available for rich results, social platforms generate accurate link previews, advertising systems can better evaluate landing pages, AI crawlers can access the content they rely on, and your crawl budget goes toward discovering pages instead of rendering them.
If you’ve confirmed your site’s diagnosis and are looking for a reliable JS rendering solution, start your free trial at Prerender.io today.
FAQs About JavaScript Rendering Problems
1. What causes JavaScript rendering problems?
They occur when a site’s content is generated in the browser by JavaScript rather than included in the HTML the server sends. Search engine crawlers, AI bots, and social media bots either cannot execute that JavaScript or delay it in a rendering queue, so they see an incomplete version of the page.
2. How do I know if my website has JavaScript rendering problems?
Start by comparing what your server sends with what users see in the browser. Run a URL Inspection Live Test in Google Search Console, compare View Source with Inspect Element, and check whether important content, metadata, or schema is missing from the initial HTML. Pages stuck in “Crawled – currently not indexed,” blank social previews, and missing rich results are additional warning signs.
3. Can JavaScript rendering problems affect AI search results like ChatGPT and Perplexity?
Yes. Many AI crawlers rely primarily on the HTML your server returns. If important content is generated only after JavaScript runs, AI systems may omit your brand, surface outdated information, or cite competitors instead.
4. Do JavaScript rendering issues affect Core Web Vitals scores?
Yes. JavaScript-heavy rendering can delay metrics such as Largest Contentful Paint (LCP) and Interaction to Next Paint (INP) because browsers must execute additional JavaScript before displaying or updating content.
5. How do I fix JavaScript rendering issues without rebuilding my site?
Use a prerendering solution like Prerender.io to generate and serve fully rendered HTML snapshots of your pages to bots, while preserving the existing JS experience for users. Prerender.io works through a middleware or CDN integration, so no framework migration or rebuild is required.